


Introducing DataHub Cloud 2.0
Context for Every Agent, Every Employee
A year ago, the question everyone was asking was whether AI agents could actually be trusted with real business data. The answer, mostly, was no. Not because the agents weren’t capable, but because they had no reliable way to understand the business context behind the data they were working with.
That’s the problem DataHub has been solving. Over the past few releases we’ve quietly built out the full stack for managing enterprise data context: ingesting it from the tools your organization already uses — Notion, Confluence, GitHub, etc. — generating it from real observed usage patterns where semantics don’t yet exist, routing it to the right people for review before an agent ever sees it, and validating that it’s actually making your agents more accurate. The activation layer is there too, through an MCP server, APIs, SDKs, and native connectors to get context to your agents, wherever they are.
With the previous release 1.0, we’ve reached a point where we’re confident enough to put a name on it. DataHub has become a Context Platform for AI agents — something we think will become an absolute necessity for organizations who are most successful implementing AI.
With these foundations in place, 2.0 release is focused on making the context platform easier to integrate and easier to monitor at scale. New integrations, better tooling for getting context into the agents your team already uses, and visibility into how it’s all being used across your organization. Let’s take a look at what’s shipping in this release:
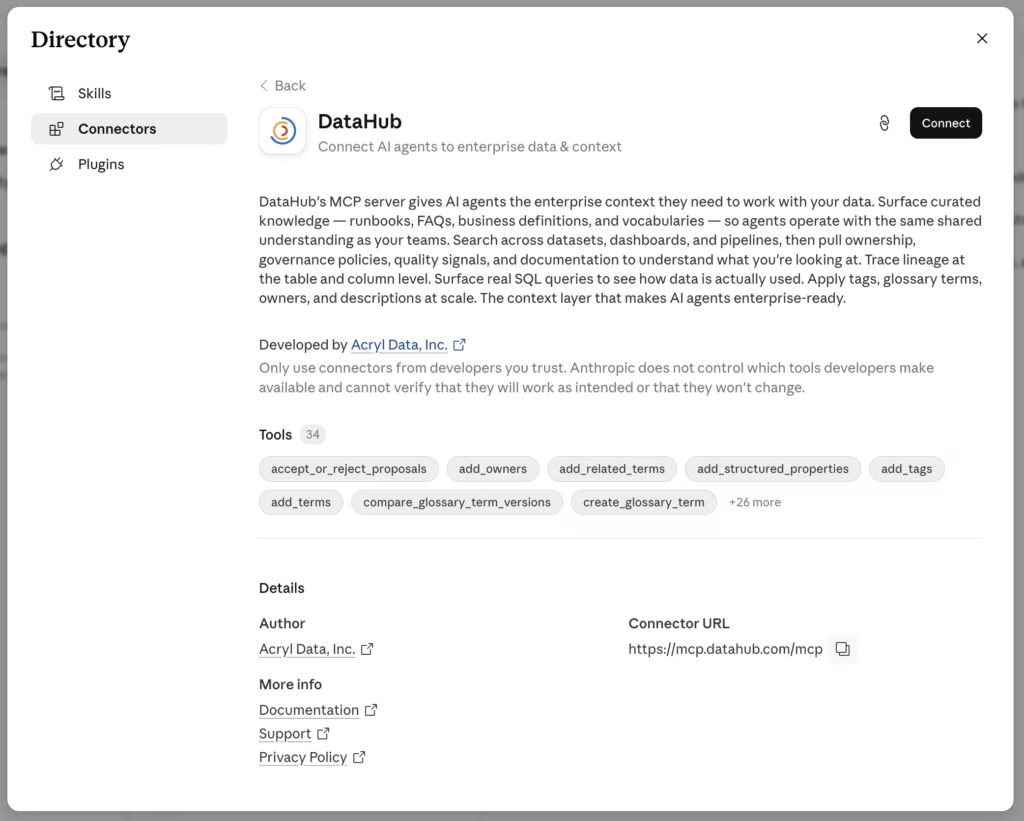
MCP Server OAuth and Claude Marketplace Connector (GA)
Every user had to configure an API token manually to access DataHub context – which kept access limited to the technical users who already knew how. Now they log in once with their DataHub or SSO account, and that’s it. The Claude Marketplace connector goes further: one admin install covers the entire organization.
You can now:
- Install the DataHub connector from the Claude Marketplace once, and every employee gets access to validated context inside Claude
- Connect to Cursor, Codex, or custom agents using existing SSO credentials. No API token setup required
- Walk away from per-user token provisioning entirely. Access is tied to identity, not keys
Learn more about the MCP Server with OAuth in our docs.
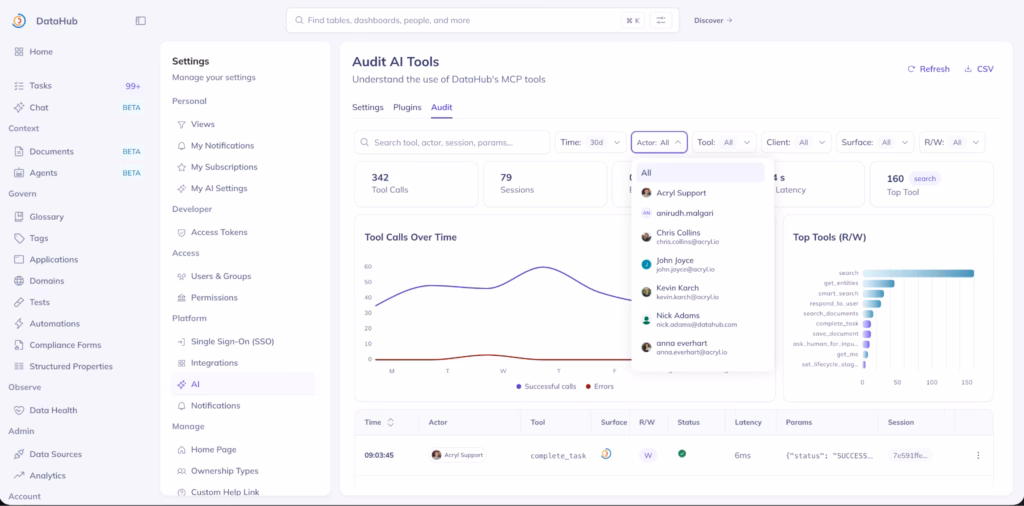
AI Tool Audit Dashboard (Public Beta)
As DataHub context reaches more agents and more users, the question shifts from “is it working?” to “who is using it, and can I prove it?” Previously, admins had to piece together usage signals from separate surfaces. The Audit Dashboard gives platform admins a single view across Ask DataHub, the MCP server, and the Claude connector.
You can now:
- See who accessed which AI tools, from which surface, at what time – with enough detail for security reviews and compliance requirements
- Identify which teams are using Ask DataHub or the MCP server and where adoption is low
- Download usage logs as a CSV to share with security, legal, or executive stakeholders
The AI Tool Audit Dashboard is now generally available to anyone with the MCP Server and Ask DataHub enabled.
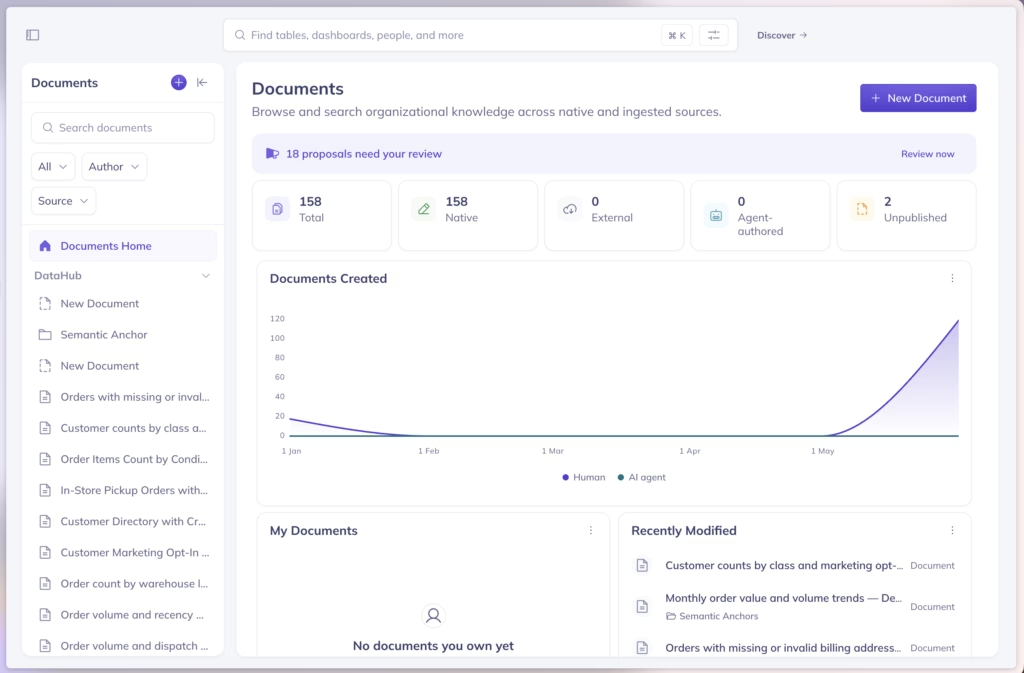
Context Documents home (Public Beta)
You can now:
- Understand at a glance where context is coming from and identify domains where coverage is sparse
- See every context document in one place – native, agent-authored, and imported from Notion, Confluence, and GitHub
- Publish or hide documents from AI agents in bulk, without navigating to each document individually
The Context Documents home page is available in Public Beta. Learn more about Context Documents in our docs.
New ingestion connectors
v2.0 adds native connectors for four new data platforms, expanding DataHub’s metadata coverage across the modern data stack.
New sources: ThoughtSpot, TimescaleDB, Airbyte, SAP HANA.
| Connector | Category | What it brings |
| ThoughtSpot | BI and analytics | Dashboard and report metadata with lineage traced back to source tables |
| TimescaleDB | Databases and time-series | Full connector support for both self-managed and Tiger Cloud deployments |
| Airbyte | ETL and pipeline tools | Pipeline and connector metadata from Airbyte workspaces |
| SAP HANA | Enterprise databases | Production-ready connector with calc-view lineage, stored procedures, and query usage from day one |
Hex connector — major upgrade (GA)
The Hex connector now extracts upstream lineage at table and column level, links Projects to Components, captures run history, and optionally pulls AI context documents directly from Hex REST APIs. The business logic encoded in your Hex notebooks flows into DataHub’s context graph, where agents can retrieve it alongside lineage and ownership signals from the rest of your stack.
You can now:
- Trace exactly which upstream columns feed each Hex visualization, not just which tables
- Pull AI context documents from Hex REST APIs so analytical knowledge flows into the context layer automatically
- See run history and freshness signals on every Hex component, accurate without manual updates
Note for existing Hex customers
Components are now ingested as Chart entities instead of Dashboards. Saved views, glossary assignments, tags, ownership, and policies on existing Hex Component assets need to be reapplied.
Snowflake and Databricks — expanded coverage (GA)
The Snowflake connector adds Internal Marketplace support and extracts dynamic-table lineage from DYNAMIC_TABLE_GRAPH_HISTORY, closing a blind spot for teams using Snowflake’s incremental processing model.
The Databricks Unity Catalog connector now ingests primary, foreign, and partition key constraints alongside opt-in Metric View ingestion, giving agents structural context they need to reason about data relationships and metric definitions, directly from Unity Catalog.
Patch-based writes for user-editable aspects (GA)
Ingestion now uses patch-based writes for user-editable metadata aspects, updating only the fields the connector is responsible for. Expert-curated context (descriptions, tags, ownership assignments) is preserved across sync cycles, even as ingestion runs daily.
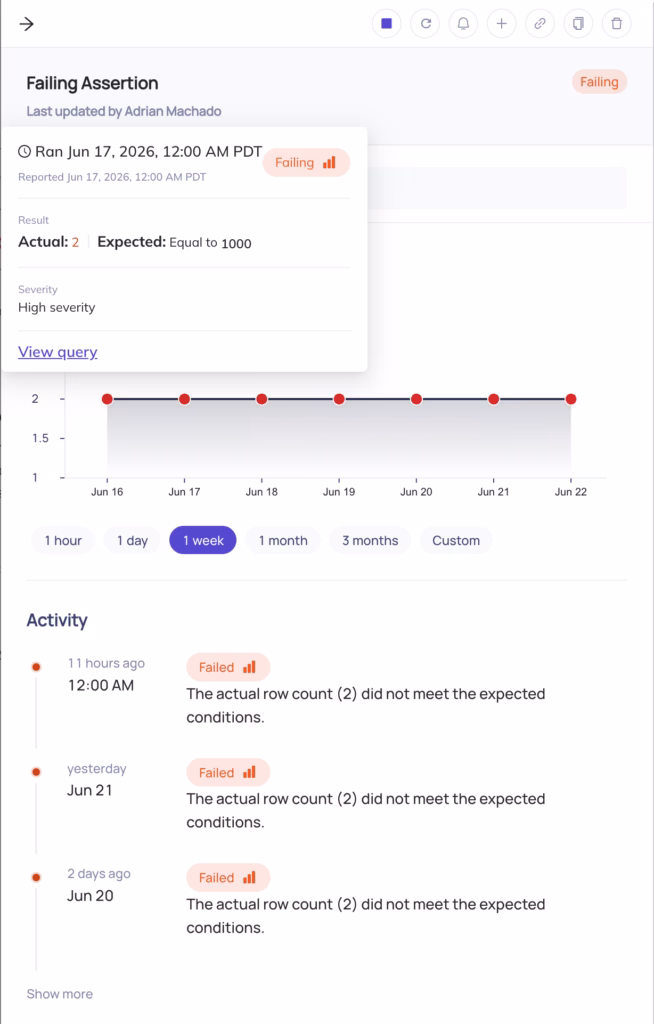
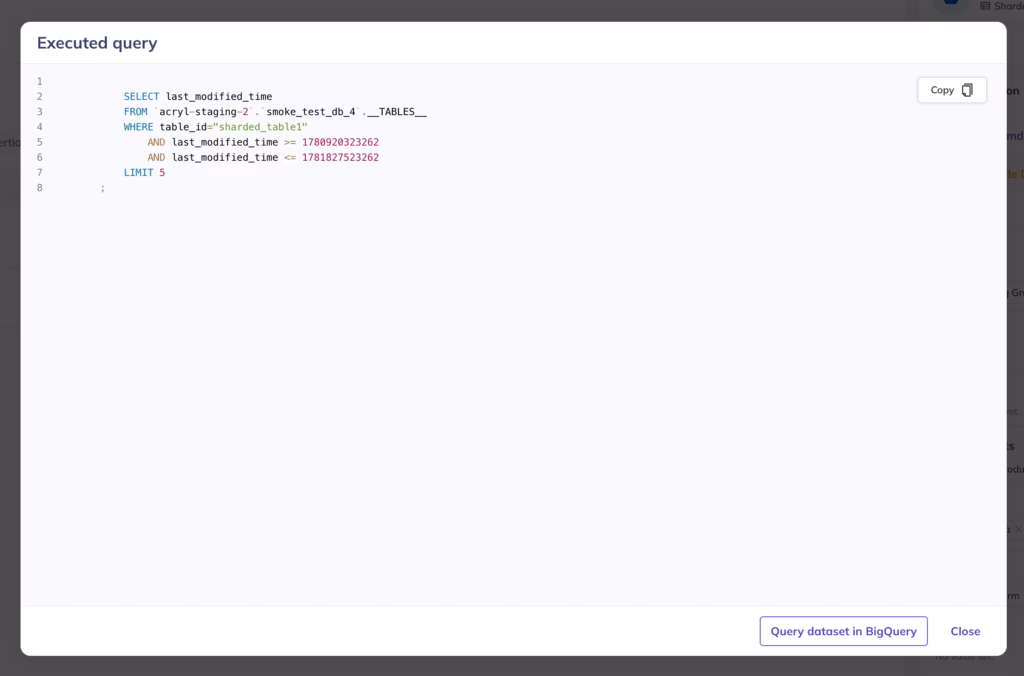
New in Observability: View failing assertion query
When an assertion fails, you can now see the exact SQL query that was executed to evaluate it.
You can now:
- Copy the query to find failing records and test fixes directly
- Review a historical log of executed queries to investigate changes to assertion configuration over time
Let’s build together
We’re building DataHub Cloud in close partnership with our customers and community. Your feedback helps shape every release. Thank you for continuing to share it with us.