


Data Lineage: What It Is and Why It Matters
Someone pings you: “The dashboard numbers aren’t adding up.” What happens next depends entirely on whether your team has data lineage:
- With lineage in place, you trace any broken metric upstream through its transformation layers, identify the schema change that caused the issue, and fix it.
- Without lineage, you start the archaeological dig—combing through Slack threads, checking pipeline logs across three different platforms, and asking around to figure out who changed what, when, and where. That process can take days.
This is not an edge case. It is the daily reality for data teams operating in complex environments with dozens of interconnected tools, hundreds of pipelines, and thousands of datasets. When something breaks (or when a stakeholder simply asks “where did this number come from?”) lineage is how you answer the question.
What is data lineage?
At its core, data lineage refers to the full lifecycle of data as it moves through your organization. It documents three things:
- Where data originates (its sources)
- How it changes along the way (its transformations)
- Where it ultimately gets consumed (its destinations)
Lineage can describe data moving within a single system (e.g., between Snowflake tables) or across an entire stack spanning data warehouses, transformation layers, orchestrators, BI tools, and ML platforms.
Think of lineage as the dependency graph for your data ecosystem. Just as engineers use dependency trees to understand how changes to one package affect others, data lineage maps the relationships between datasets, pipelines, dashboards, and models so teams can understand how a change in one place ripples through everything downstream.
To work with lineage effectively, you need to understand a few foundational concepts:
- How direction works in a lineage graph
- What level of granularity is available
- How lineage gets captured in the first place
How direction works: Upstream and downstream
These terms describe the direction of data flow:
- Upstream refers to the sources and earlier transformations that feed into a given dataset
- Downstream describes everything that consumes or depends on it—dashboards, reports, models, and other datasets.
The key nuance: Upstream and downstream are context-dependent. A dbt model is downstream of its source tables, but upstream of the Looker dashboard that queries it. Understanding this relative positioning is what makes lineage useful for both root cause analysis (tracing upstream to find the source of a problem) and impact analysis (looking downstream to understand what breaks if you change something).
Levels of granularity: Table-level vs. column-level lineage
Not all lineage is created equal. The two main types of data lineage are defined by the level of detail they capture, and that granularity determines what you can actually do with them:
- Table-level lineage shows relationships between datasets—which tables feed into which other tables. It is the most common form of lineage and provides a useful high-level view of data dependencies.
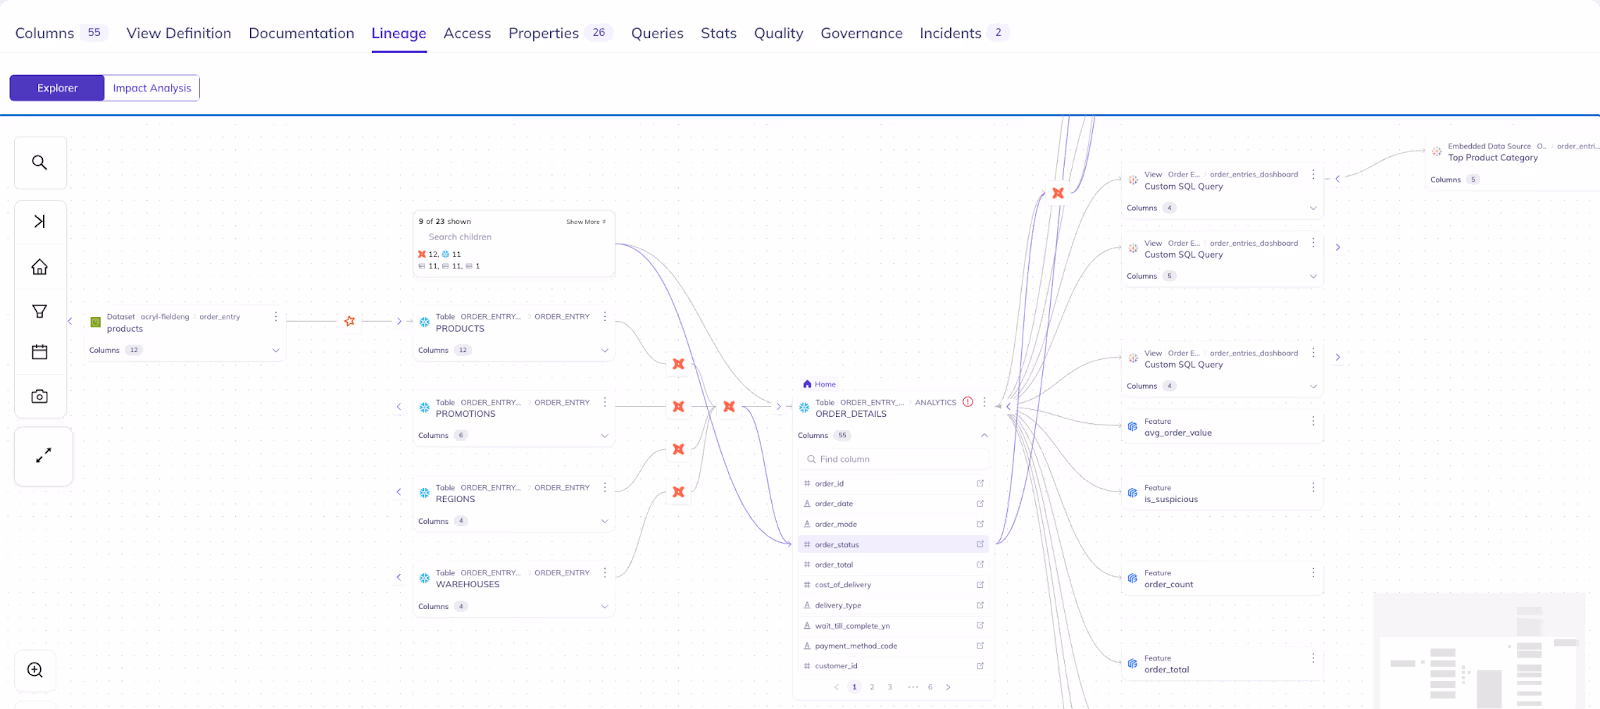
- Column-level lineage goes deeper: It traces individual fields from raw source tables through every transformation to their final destination in a report or model. This granularity is what makes precise debugging, compliance tracking, and model auditing possible.
When you need to know exactly how a specific metric was calculated or which source field introduced a data quality issue, table-level lineage points you to the right table. Column-level lineage points you to the exact field.
How lineage gets captured: SQL parsing
Understanding what lineage is and how it’s structured is one thing. Understanding how data lineage works in practice is another. The practical question is how it gets built in the first place. SQL parsing is one of the most common techniques for doing this automatically.
SQL parsing analyzes the queries that define data transformations to identify which source data elements feed into which output columns, mapping joins, aggregations, filters, and calculations along the way.
This is particularly valuable for systems that don’t natively expose lineage—legacy databases, bespoke transformation scripts, and reporting tools that use SQL under the hood but don’t surface the dependency information themselves. The accuracy of the parser matters significantly here. A parser that misses transformations or incorrectly maps dependencies creates lineage gaps that undermine trust in the entire graph.
Data lineage vs. related concepts
Data lineage is closely related to several other data management concepts. Because these terms are often used interchangeably (or confused with one another), it’s worth drawing clear boundaries:
| Concept | What it is | Relationship to lineage |
| Data provenance | The historical record of data, including where it was created, who created it, under what conditions, and what authority it carries | Lineage and provenance answer different questions but draw from the same underlying metadata. Lineage tracks how data moves and transforms. Provenance tracks origin, custody, and authority |
| Data governance | The framework of policies, roles, and responsibilities that defines how an organization manages its data | Lineage is one of the foundational capabilities that makes governance enforceable. Without lineage, governance policies exist on paper but cannot be verified in practice |
| Data flow | The movement of data between systems or components in a pipeline | Lineage includes data flow but adds the full history of transformations, dependencies, and consumption points. Flow describes movement. Lineage provides context and traceability |
| Data catalog | A searchable inventory of an organization’s data assets, including metadata, ownership, and documentation | Lineage enriches a data catalog by adding relationship context. A catalog tells you what data exists. Lineage tells you how it connects |
Benefits of data lineage: Eight essential use cases
Lineage is not a documentation exercise. It is operational infrastructure. As data ecosystems grow more complex and tooling proliferates, the relationships between datasets, pipelines, dashboards, and ML models become increasingly tangled. Lineage is how teams maintain visibility, accountability, and control.
Here is where lineage delivers concrete value.
1. Impact analysis
Before you change a schema, deprecate a dataset, or migrate a platform, you need to know the blast radius. Lineage shows every downstream dashboard, model, pipeline, and team that depends on the data you are about to modify. Without this visibility, changes become gambles; you deploy and hope nothing breaks.
With lineage-powered impact analysis, data engineers make confident changes. They know exactly what is affected, can notify the right stakeholders, and can coordinate updates before deploying rather than firefighting afterward.
2. Root cause analysis
When a metric does not match expectations or a pipeline fails, lineage lets you trace the problem upstream through transformation layers to the exact source where things went wrong. Was it a schema change in the source system? A failed ingestion job? A transformation that introduced null values? Lineage provides the map to answer these questions in minutes rather than days.
“The ability to trace a broken dashboard back through every transformation layer to the exact source field where the issue started—that is what turns lineage from a nice-to-have into something teams use every single day.”
Paulina VargasProduct Designer
3. Compliance and audit
Regulations like GDPR, CCPA, SOC 2, and HIPAA require organizations to demonstrate how personal and sensitive data flows through their systems. Lineage provides the audit trail, showing where data originates, how it transforms, who accesses it, and where it ends up.
Without lineage, compliance teams spend weeks manually reconstructing data flows for auditors. With lineage, those same audit reports take minutes to generate. This is not just an efficiency gain. It fundamentally changes an organization’s ability to demonstrate data accuracy and compliance posture from reactive to demonstrable.
4. Change management and safe deprecation
Legacy systems and unused datasets accumulate over time. Every organization has tables that no one is sure to delete because no one knows what depends on them. Lineage makes these decisions safe by revealing all downstream dependencies. Teams can confidently deprecate assets, clean up unused data, and retire legacy systems without collateral damage.
DPG Media used lineage-powered usage tracking and impact analysis to safely clean up unused tables, saving 25% in storage costs. That kind of savings is only possible when you can prove that removing something will not break anything downstream.
5. Data explainability
“How did we arrive at this number?” It is one of the most common questions data teams field from business stakeholders, and one of the hardest to answer without lineage. Lineage traces dashboard metrics back through every transformation to source data, providing a clear chain of custody that answers provenance questions and builds trust with the business users who rely on data for decisions.
6. Metadata propagation
Tags, descriptions, PII classifications, ownership assignments… Maintaining this metadata across hundreds or thousands of downstream assets is unsustainable when done manually. Lineage enables metadata to propagate automatically from source to consumer. Document a dataset once at the source, and all relevant data assets downstream inherit that context through the lineage graph.
This turns metadata management from an ongoing manual burden into a scalable, automated process. Governance coverage increases without proportionally increasing the effort required to maintain it.
“Propagating metadata across lineage sounds incremental—it’s not. When tags and classifications flow automatically through the graph, you eliminate the manual chase that stalls AI projects and governance programs alike. Coverage goes from spotty to comprehensive overnight. AI and Data practitioners spend less time tagging, more time building. And when an audit hits, you’re not scrambling—the context is already there.”
Manuela WeiPrincipal Product Manager
7. Debugging ML models
When model performance degrades, the cause is often upstream—a schema change in source data, a transformation that started producing nulls, or a data quality issue that propagated through the pipeline into training features. Column-level lineage lets data scientists trace these dependencies with precision, seeing exactly which upstream changes affected which model inputs.
This shifts model debugging from guesswork to systematic investigation. Instead of retraining and hoping, teams identify the specific data quality issue, fix it at the source, and verify the fix through the lineage graph.
8. AI agent readiness
As organizations adopt conversational tools and AI agents that operate over their data, lineage becomes the foundation for trusted answers. An AI agent that can trace its response back through verified data paths to authoritative sources produces answers users trust. Without lineage, AI tools can surface plausible-sounding responses grounded in stale, duplicated, or incorrect data…and nobody can verify which.
Lineage is the critical infrastructure layer that connects AI capabilities to provenance-grounded trust. Tools like Ask DataHub leverage lineage to ensure that answers reflect verified, traceable data paths rather than unchecked retrieval.
The problem with lineage that stops at system boundaries
Individual tools increasingly offer native lineage capabilities. Snowflake and BigQuery have system tables you can query for dataset dependencies. dbt lets you declare lineage relationships within model definitions. These are useful—but they only see within their own walls.
The reality of a modern data stack is that data rarely stays within one system. A table ingested into a data lake gets transformed in dbt, orchestrated by Airflow, loaded into Snowflake, visualized in Looker, and consumed as training features for an ML model. No single tool in that chain sees the full picture.
This is where most organizations hit a wall: They assemble partial lineage from individual tools and end up with fragments—a view of what happens inside the warehouse, a view of what happens inside the transformation layer, maybe a view of what happens inside the BI tool. But the connections between systems, the cross-system dependencies that matter most when something breaks at a boundary, remain invisible.
“Most teams do not lack lineage—they lack connected lineage. They have five partial views from five different tools, and the gaps between those views are exactly where the most critical dependencies live.”
Manuela WeiPrincipal Product Manager
The result: When a source schema change breaks a downstream dashboard, the team running the warehouse cannot see the dashboard. The team running the BI tool cannot see the source table. And the team that made the change had no way to know either of them would be affected.
Solving this requires a centralized platform that delivers robust data lineage across systems and stitches it into a single, unified graph. Not a platform that replaces your existing tools, but one that connects them—providing the end-to-end visibility that no individual tool can offer on its own. Learn more about how DataHub implements end-to-end data lineage.
How DataHub delivers *complete* lineage
DataHub approaches lineage as a cross-system problem, not a single-tool feature. Every capability below addresses a specific operational challenge that data teams encounter when they try to build a complete lineage picture across their stack.
“My favorite part about DataHub is the lineage because this is one really easy way of connecting the producers to the consumers. Now the producers know who is using their data. Consumers know where the data is coming from. And it is easier to have accountability mechanisms.”
Sherin ThomasSoftware Engineer, Chime
| DataHub Capability | What it does | Why it matters |
| Automated end-to-end lineage | Captures lineage automatically across 100+ integrations—databases, data lakes, ETL pipelines, dbt models, BI dashboards, and ML models—and stitches it into a single unified graph. Automated, frequent ingestion keeps the graph current. | No manual data mapping. One complete view instead of fragments from individual tools. |
| Column-level lineage | The framework of policies, roles, and responsibilities that defines Traces individual fields from raw source tables through every transformation to final reports and model features. | Root cause analysis, compliance tracking, and model debugging at the granularity teams actually need. When a metric breaks, you know which field—not just which table. |
| SQL parsing | Automatically parses SQL queries to extract lineage where native tools don’t expose it—covering legacy systems, bespoke pipelines, and cross-system transformations. | Fills the gaps that individual tools leave at their system boundaries. Complete lineage even when not every tool cooperates. |
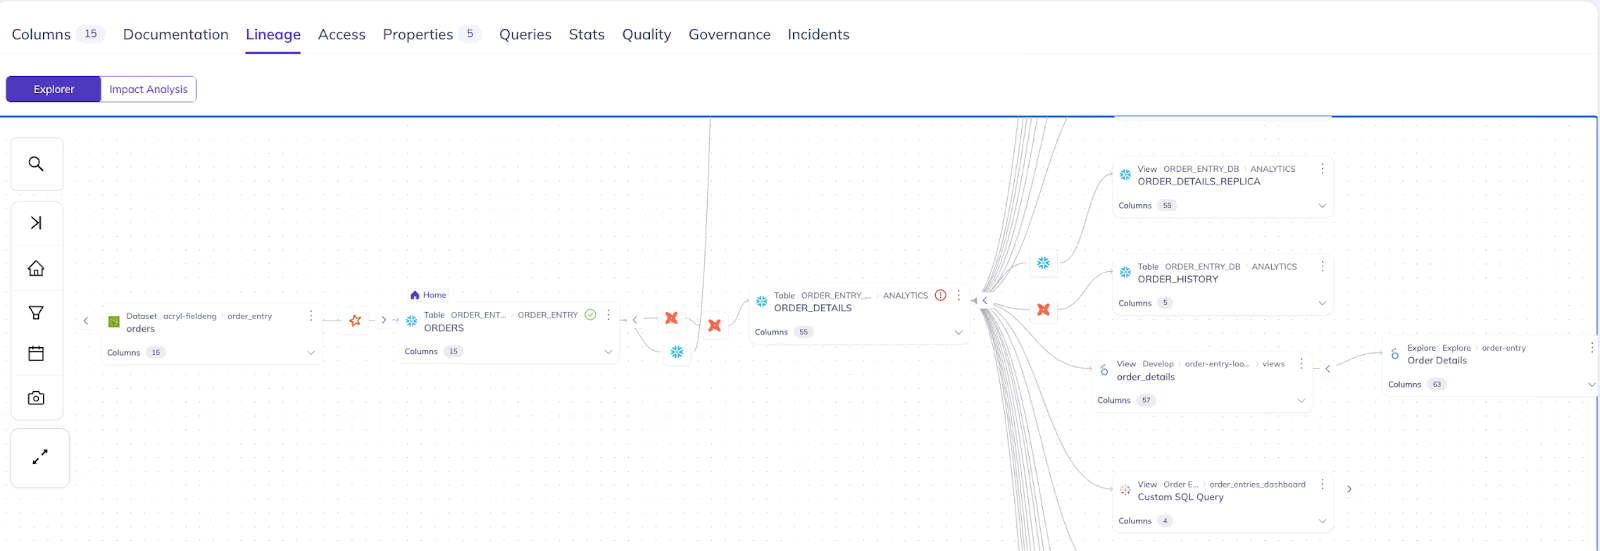
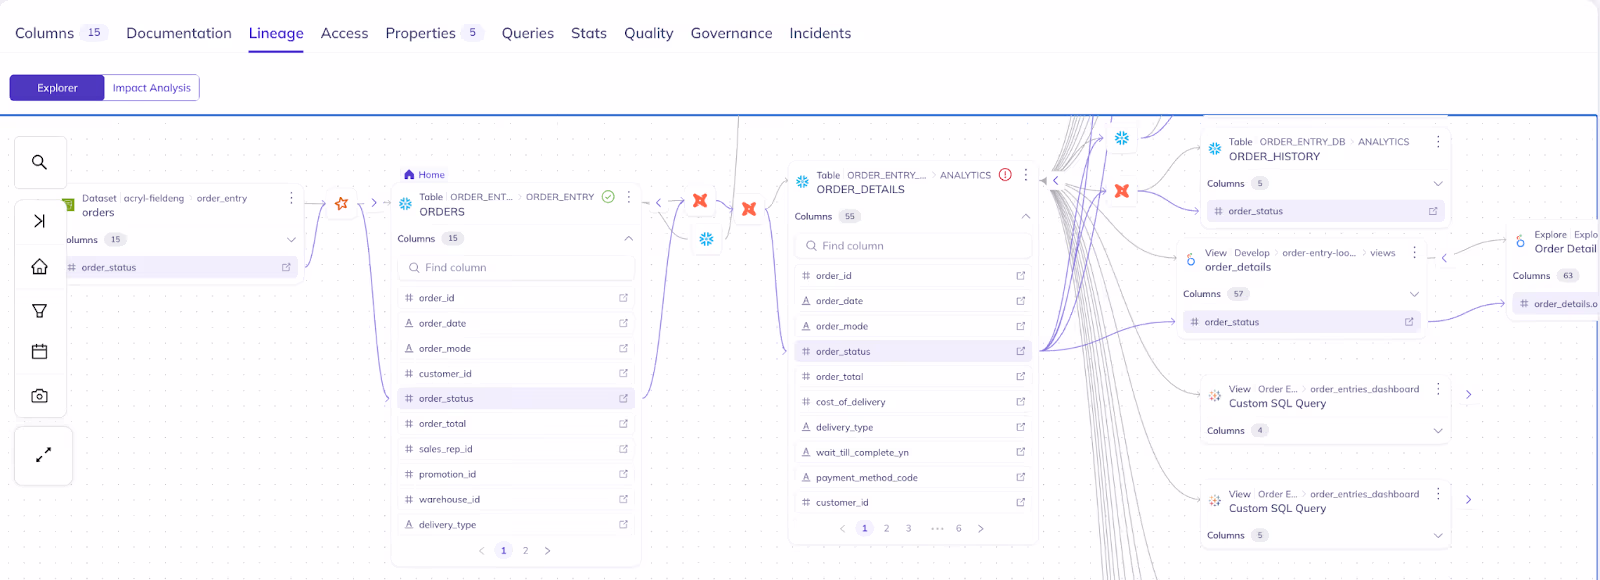
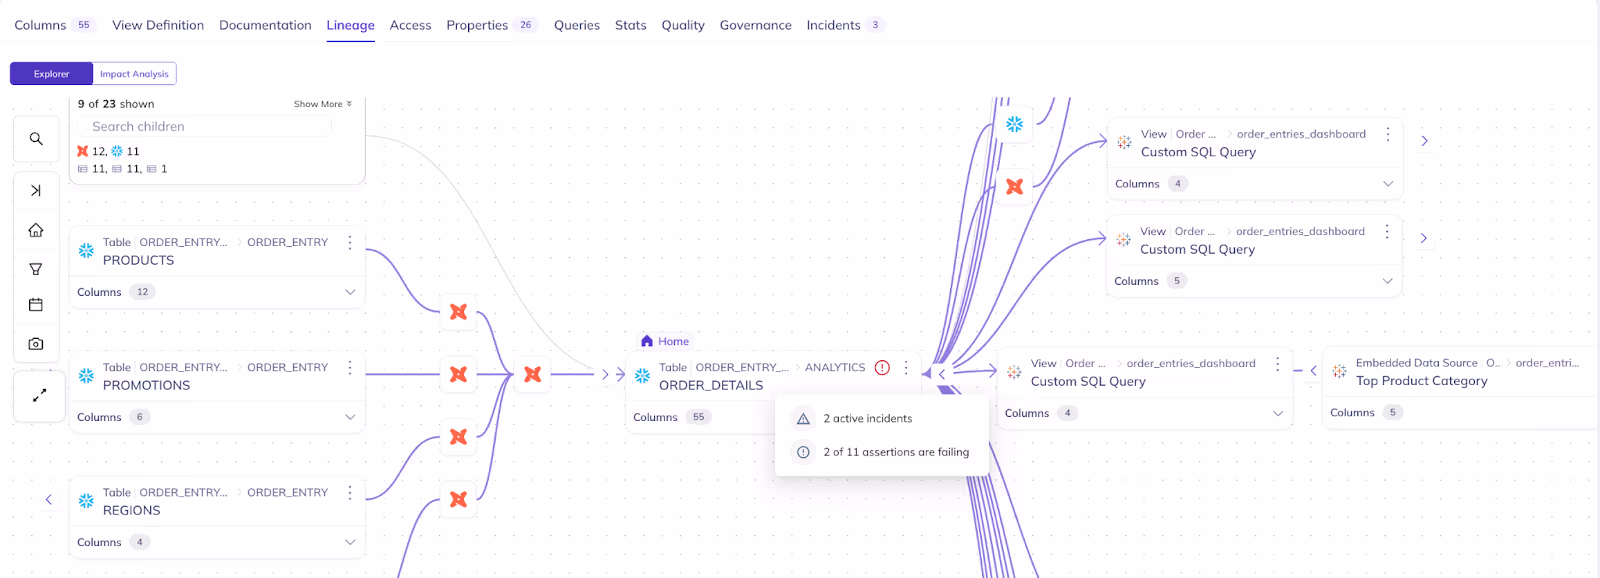
| Visual lineage explorer | Interactive graph visualization for visualizing data flows, with filtering by time, owner, or platform. Zoom from high-level data flows to column-level detail. | Turns raw metadata into something teams can navigate intuitively during debugging, planning, and impact assessment. |
| Impact analysis and change preview | Surfaces every dependent dashboard, model, pipeline, and consumer before you modify a dataset. | Prevents breaking changes instead of reacting to them. Lineage operationalized, not just visualized. |
| Metadata propagation via lineage | Tags, descriptions, and classifications flow automatically through the lineage graph from source to downstream assets. | Document once. Governance scales with your data estate without proportionally more manual work. |
| Lineage-powered search and discovery | Search “what feeds this dashboard” or “where is this column used” to navigate data through relationships, not just keywords. | Lineage becomes a discovery mechanism—useful every day, not just when something breaks. |
| Unified data and AI lineage | A single lineage view spanning raw data through transformations to ML model features and AI applications. | Captures the dependencies that matter most for model reliability and AI governance—beyond the warehouse boundary. |
Is your lineage actually working? Here’s how to tell
The real test of data lineage is not whether it exists in your environment. It is whether your team can do the following:
- ✅ Make schema changes confidently, knowing the full downstream blast radius before deploying
- ✅ Trace a broken metric to its root cause in minutes, not days
- ✅ Generate a compliance audit report on demand, without manual reconstruction
- ✅ Deprecate unused datasets safely, with proof that nothing downstream depends on them
- ✅ Debug a degraded ML model by tracing upstream data quality issues to the exact source field
- ✅ Answer “where did this number come from?” with a clear chain of custody from dashboard to source
- ✅ Trust the answers from AI tools and conversational agents because they’re grounded in verified data paths
- ✅ Onboard new team members who can understand the data estate through lineage rather than tribal knowledge
If your team can do all of this today, your lineage is working. If some of these feel out of reach, the gap is likely not a lack of lineage—it’s a lack of connected, cross-system lineage.
That’s the difference organizations like Funding Circle and DPG Media have seen after implementing DataHub.
- At Funding Circle, column and table-level lineage across 23,000+ datasets enables self-service impact analysis for over 300 users—meaning engineers, analysts, and data scientists can independently assess the downstream consequences of any change without filing a ticket or pinging a Slack channel.
- DPG Media used lineage-powered usage tracking to confidently identify and deprecate unused tables, saving 25% in storage costs.
These are not aspirational outcomes. They are the operational baseline that complete, cross-system lineage makes possible. If your current setup cannot deliver them, DataHub can.
Getting started with DataHub
Explore DataHub’s data lineage capabilities →
See DataHub Data Lineage in action →
Read the lineage feature guide in the docs →