


Trusted Context for Talk-to-Data: April 2026 Town Hall Highlights
Every team building a talk-to-data agent eventually hits the same wall.
The model is fine. The SQL is mostly right. The answers are wrong because the agent does not know what your business actually means — which definitions the data team has curated, which tables are authoritative, which datasets have gone stale. That is a context problem. It is the gap that runs underneath every team trying to ship AI on top of their data, and it was the through-line of the April town hall.
We brought together teams running production at scale, ecosystem partners building on top of DataHub, and community members shipping their own context-aware agents. The takeaway from every session: governance and context are not the slow lane to AI. They are the only path that actually works.
This recap walks through Pinterest‘s production playbook, Omni’s new DataHub integration, the open-source DataHub Analytics Agent we shipped on the same day as the town hall, and a community journey that started with a catalog and ended with a Pinecone connector.
Community wins: Hackathons, champions, and 15,000 members
Before we dig into the sessions, a few quick signals from the community:
- DataHub × Nebius hackathon – Our in-person hackathon in San Francisco wrapped on April 10 with three winning teams: DataHub Agent On Call (a four-agent on-call triage loop), Project North Star (an anomaly-to-resolution co-pilot), and MediGuard (healthcare data quality guardrails). A global online hackathon is in the works for the second half of 2026, open to community members everywhere. Keep an eye out for details.
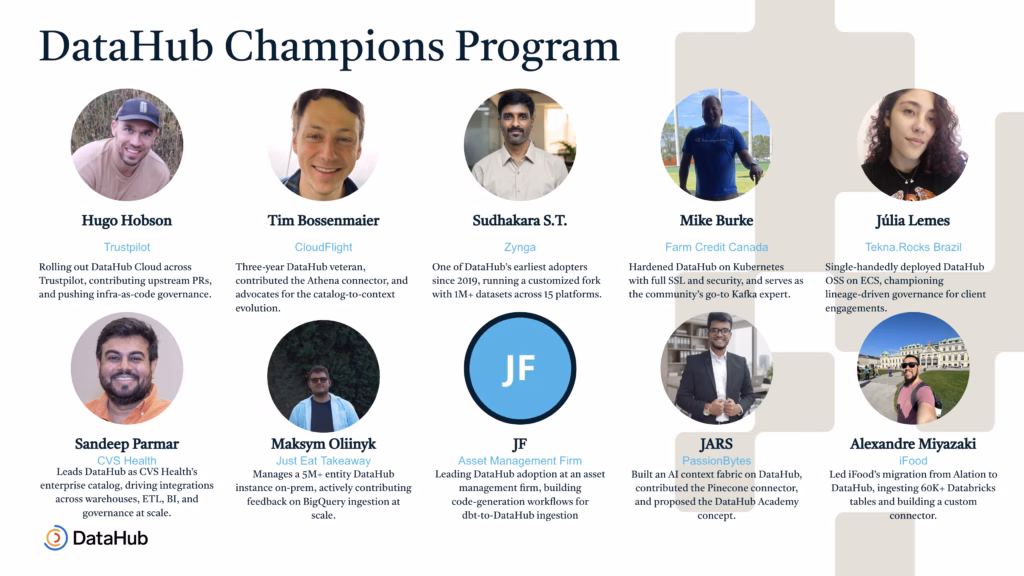
- DataHub Champions Program – Our founding cohort is live. Champions help with community questions, host events, and shape the product roadmap.
- 15,000 community members – We crossed the milestone two weeks before the town hall, and key takeaways from our community survey will land in the May town hall.
- Upcoming meetups – Toronto in May, Chicago in July, and New York later this year, all hosted by customers.
Details for all of these land in the DataHub Slack community first.
Pinterest’s journey: from 400,000 tables to a governed AI foundation
If you have ever inherited a data lake with no lifecycle policy, the opening of the Pinterest session will sound painfully familiar. Aman Gairola, Martin Yau, and Keqiang Li walked through how Pinterest went from 400,000+ tables, mostly undocumented, to a curated 100,000-asset foundation that powers a production text-to-SQL agent.
The starting point was rough:
- 500 new tables created every day, none of them governed
- Roughly 30% of the most-queried tables owned by people who had already left the company
- Documentation existed mostly as tribal knowledge in Slack threads
- The top 500 most-queried tables drove 80% of the volume. Almost none had real documentation
Their fix did not start with AI. It started with governance that the platform itself enforces.
A governance operating model with three pillars
The team built their internal DataHub deployment, called PinCat, into the choke point for table creation. No tier, owner, retention, and domain — no table. Pre-receive listeners enforce this at the metastore level, so metadata cannot be bypassed downstream.
“All the institutional knowledge is centralized in one place in DataHub. DataHub serves as the source of truth for this data.”
Martin YauEngineering, Pinterest
The team rolled this out in phases — optional, then enforced retention, then mandatory creation — instead of flipping a switch overnight.
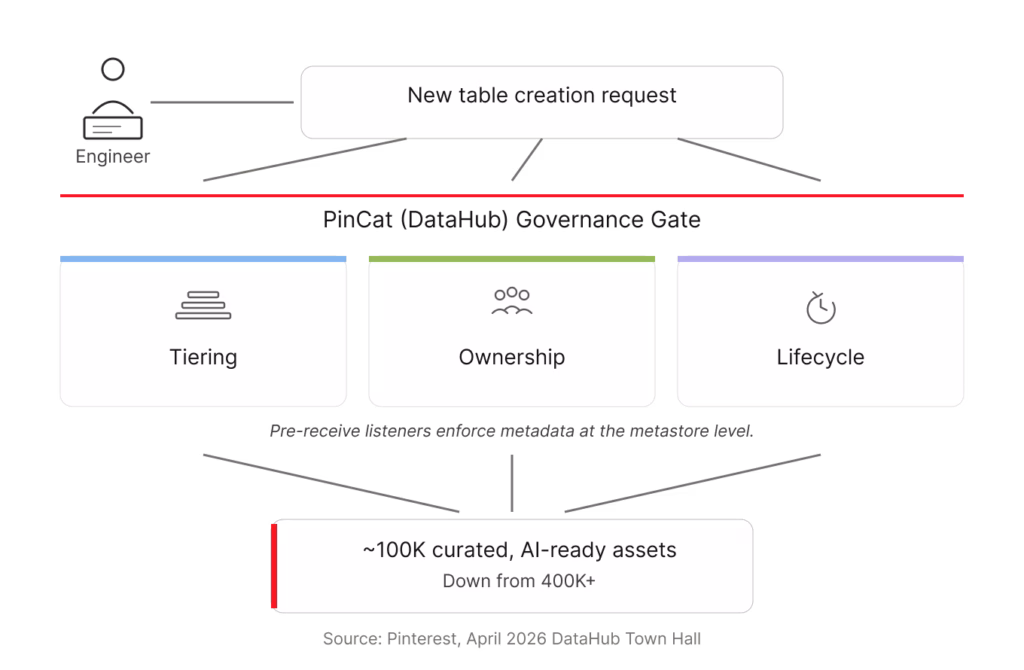
The operating model rests on three pillars:
| Pillar | What it does | Why it matters for AI |
| Tiering | – Tier 1 tables get strict documentation, ownership, and quality requirements. – Tier 2 needs basic context. – Tier 3 starts new and gets aggressively retired if it is not promoted. | Creates focus. The team invests deeply in the small set of tables that drive the majority of queries, instead of trying to govern everything equally. |
| Ownership | Tables are owned by a team identifier, not an individual. Domain tags add org-level accountability. | Survives attrition. No single departure orphans a table. |
| Lifecycle | Retention is enforced at table creation. Tier 3 tables get auto-deleted on a short clock if they are not promoted. | Stops the sprawl at the source instead of fighting it later. |
The same model extends to Pinterest’s Airflow workflows — same tiering, same lifecycle pressure, applied to compute cost instead of storage cost.
From schema chaos to context-aware agents
Once governance was in place, the team turned to the harder problem: schema complexity.
Pinterest uses Thrift-based nested data structures for ingestion. The advantage is that logging is flexible. The cost is that anyone analyzing the data has to navigate deeply nested objects — feed view → object view → user action — that grow organically and depend almost entirely on tribal knowledge to interpret.
The team started encoding enum definitions, attributing meanings, and SQL fragments directly into PinCat as structured metadata. Two things happened:
- On-call engineers stopped reverse-engineering the schema every time something broke
- Agents could now reason about the data the way the experts did
The first outcome solved a real on-call pain. The second outcome is where the analytics agent stopped being a demo and became useful.
“Without the domain context, the agent needed multiple directed prompts and custom filters. With it, the same agent went from symptom to root cause in one or two steps. We started calling it the Analytics Sage.”
Aman GairolaEngineering, Pinterest
Both runs used Claude Opus 4.6 in balanced mode. The model did not change. The substrate it was reasoning over did.
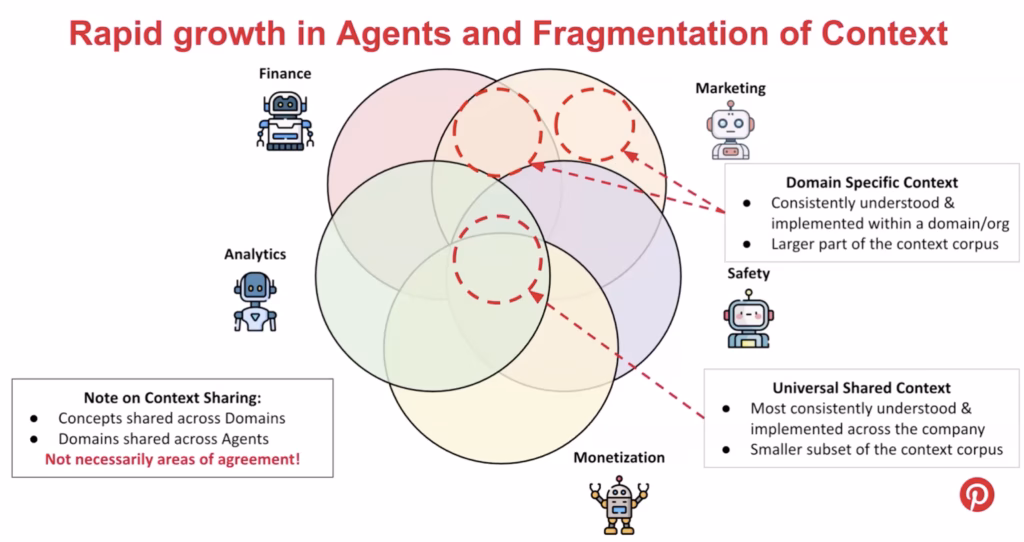
When agents multiply: solving context fragmentation
As Pinterest’s roughly 2,500 analysts across dozens of domains started building their own agents — finance, marketing, safety, monetization, analytics — the context corpus fragmented. Some context was genuinely shared across the company. Most of it was not.
Worse, the overlapping context was not always consistent. Finance’s definition of daily active users is different from marketing’s. Safety strips bots out of the raw count first, and that filtered set becomes marketing’s view. None of these are wrong individually. But when two agents reference different definitions, business users get answers that contradict each other, and the failure mode is silent.
Pinterest’s response was to build agent evaluation into the curation workflow:
- Local evaluation: Engineers and domain experts can iterate on context in their own dev environment, running it against a question set before any commit
- On-commit regression: When global context changes, the workflow runs evaluations across every dependent agent, not just the one being modified
- Cross-domain validation: Shared context gets evaluated across domains, so a finance update cannot silently break the marketing agent
Context-intent embeddings and governance-aware ranking
Keqiang took the back half of the session into the agent architecture itself.
Pinterest’s 100,000 governed tables still had a documentation problem. Manual descriptions for that many tables is not feasible, so the team scaled documentation through three mechanisms: LLM-generated descriptions from code, glossary terms, and representative queries; join-based lineage that propagates glossary terms from documented columns to undocumented ones; and vector similarity for the long tail. Combined, these saved roughly 70% of the manual documentation work, with 75% of analyst respondents rating the LLM-generated descriptions as usable or better.
Two principles shape how Pinterest indexes and retrieves context.
1. Do not embed raw artifacts.
Naive RAG over your schema or query history breaks for predictable reasons that compound at scale: questions don’t match descriptions, deprecated tables outrank production ones, and the queries that actually answer business questions depend on join logic and company conventions that no single table description captures.
Pinterest’s solution is to inject governance context — glossary terms, table descriptions, domain assignments — before generating embeddings. The pipeline parses each historical SQL query, translates it into the analytical questions it could answer, and embeds that enriched representation.
“Every SQL query your organization has ever written captures real domain expertise. The tables your analysts chose, the joins they built, the metrics they computed — that history is a library of solutions written by real analysts.”
Keqiang LiEngineering, Pinterest
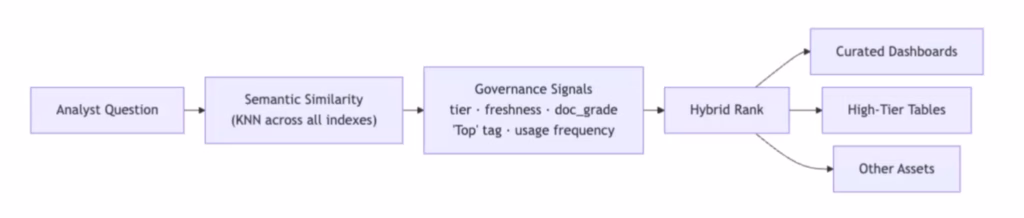
2. Governance-aware ranking.
When the agent retrieves candidates at query time, semantic similarity is one signal among several. Tiering, freshness, documentation grade, and usage frequency all factor into ranking. Tier 1 dashboards override lower-tier results. Certified content gets surfaced before the agent generates new SQL.
The same architecture is being extended to Pinterest’s roughly 98,000 Superset charts — work that is still in progress, with the team applying the same indexing principles to make charts discoverable by analyst intent rather than keyword. Where curated dashboards exist, the routing layer surfaces them first, so a trusted dashboard answering the question gets pointed to instead of generating new SQL.
The result: the most-used AI agent at Pinterest
Since launch, Pinterest’s Analytics Agent has covered 40% of the company’s analyst population and ran at 10x the usage of the next most-used agent at the company.
User feedback was strongly positive. In a survey of analyst users, 72% reported the agent made their work better, and 30% identified asset discovery as the top thing they wanted more of — more than query authoring or answer quality.
For a deeper dive, check out the full Pinterest case study.
Omni × DataHub: pairing the semantic layer with the governance layer
Most teams adopting both BI and data catalog tools end up with overlapping definitions: metrics defined one way in the BI tool, slightly differently in the catalog, and a third way in someone’s spreadsheet. Omni’s new DataHub integration takes a different approach by connecting the two layers directly.
Peter Whitehead from Omni walked us through the integration and the build story behind it.
How the integration works
Omni is an AI, BI, and embedded analytics platform built on a semantic layer that encodes business logic — metric definitions, joins, Topics, view files — down to the column level. End users interact through dashboards, conversational AI, spreadsheets, and raw SQL.
DataHub provides the governance layer underneath: ownership, lineage, classification, glossary terms, and trust signals across the broader ecosystem. The integration catalogs Omni’s dashboards and semantic model in DataHub, so teams across the company can see and govern Omni’s assets in the same place they manage the rest of their data.
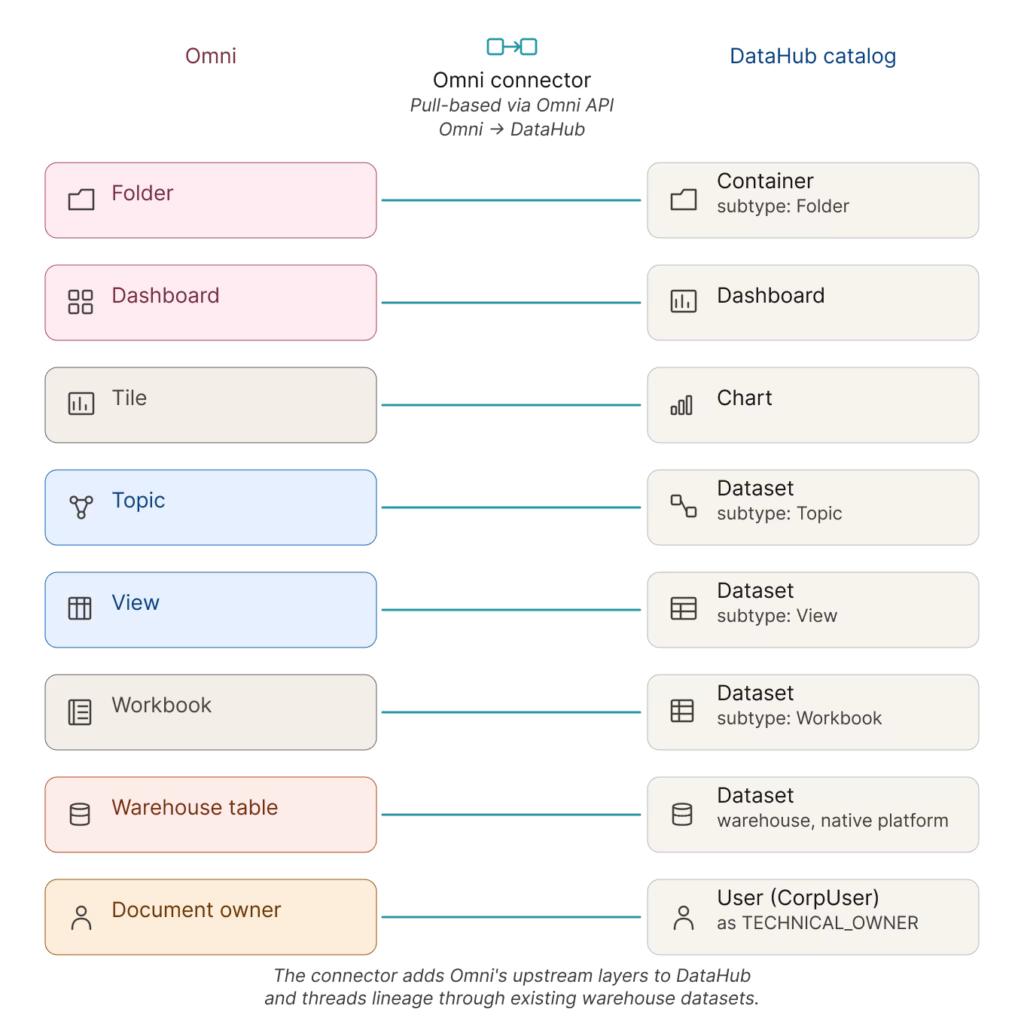
The integration is pull-based. DataHub pulls Omni’s objects through the Omni API and maps them into the catalog: folders, owners, dashboards, workbooks, and the full semantic model — topics, views, dimensions, and measures. Teams get end-to-end visibility from raw warehouse tables, through transformation tools like dbt, into Omni’s shared model and individual dashboards.
Building the integration with DataHub Skills
Peter also walked through how he built the integration.
“I am not a software engineer. I am a solutions engineer. I built this with me and my friend Claude.”
Peter WhiteheadOmni
Peter’s first pass took a week and stalled on scaling problems. Then, DataHub Skills launched. He fed Omni’s hierarchy diagrams, the API documentation, the CLI documentation, and existing integration patterns to Claude Code as context, with the new skills providing the DataHub-specific scaffolding. The PR review skill in particular gave him the confidence to ship. His first open-source commit landed in the project. It’s the same pattern Pinterest is solving for analytics agents, applied to development workflows.
The Omni connector ships in DataHub today. The full concept mapping and configuration options live in the docs.
One more thing: the open-source DataHub Analytics Agent
Shirshanka Das, Co-founder and CTO at DataHub, walked through the same blind spot every talk-to-data agent has.
The models have improved. SQL generation is mostly right.
The answers are wrong because the agent does not know what the data means: which table holds the canonical metric, how the business defines “revenue,” whether the dataset has been refreshed in the last week. That is a context problem, and the catalog is where the context already lives.
“This is not an LLM problem. It is a context problem.”
Shirshanka DasCo-founder and CTO, DataHub
Most teams ship a talk-to-data agent by building context from scratch — a separate semantic layer, a vector store of DDL, business terms hand-modeled inside the agent. That work starts incomplete and goes stale. The catalog already holds the glossary terms, the lineage, the quality signals, and the usage patterns. The argument was simple: use what you already have.
To make that practical, Shirshanka announced the open-source DataHub Analytics Agent under Apache 2.0, available the same day as the town hall.
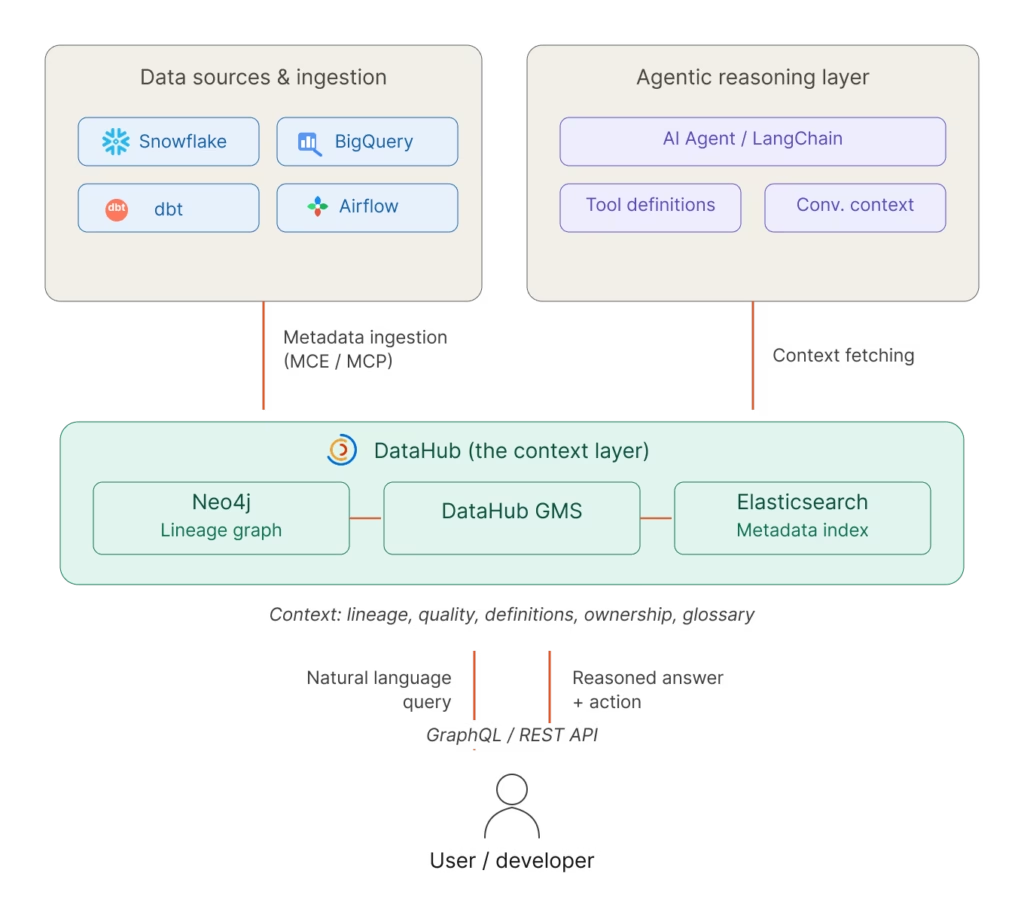
How it’s wired
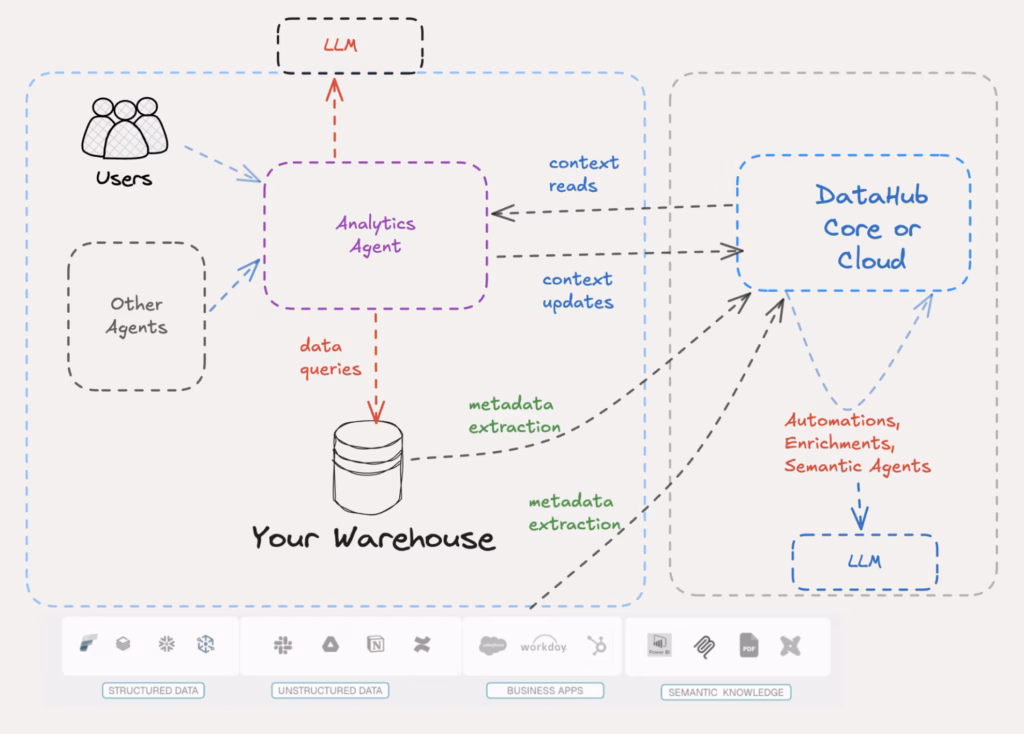
The agent is a web app deployed alongside your DataHub instance. Three connections: DataHub for context (over MCP and the Agent Context Kit), your warehouse for data via standard drivers, and the LLM of your choice.
It works against DataHub Core and DataHub Cloud over the same rails. Cloud adds automations and semantic agents that enrich context in the background, so the same agent gets richer signal there without code changes.
The writeback loop is the part that matters
The live demo had two moments worth lifting out.
In the good case, a user asked which sellers had the worst delivery SLA. The agent found the existing glossary term, used the precise definition the data team had curated, and returned a grounded answer with a chart. The context-quality indicator visibly moved from “poor” to “good” as the conversation progressed.
In the honest case, a user asked which product categories were considered sensitive. There was no glossary definition for “sensitive.” Instead of guessing, the agent searched the catalog, came up empty, and offered to help fill the gap. A built-in skill reflected on the conversation, proposed specific glossary additions, and wrote the updates back to DataHub once the user confirmed.
That second moment is the part that compounds. The agent does useful work today, and the context platform underneath gets richer every time it runs.
The repo is live. The launch blog covers the read and write context model in detail.
Community spotlight: from catalog to context to contributor
Jishanahmed Shaikh — known in the community as JARS — handles engineering at PassionBytes and is one of the founding members of the DataHub Champions program. He describes himself as community-driven, and his three-phase journey with DataHub showed it.
“Is your data catalog just sitting there as a static library? Because if it is, you are missing out on a lot of exciting stuff.”
Jishanahmed ShaikhEngineering, PassionBytes
JARS started by standing up DataHub for a client as a standard catalog: tags, business definitions, classification. Then his team’s AI agents began returning vague answers despite proper fine-tuning. The fix was not better prompts. It was routing every agent question through DataHub first to retrieve the relevant domain, the gold-standard tables, and the priority signals before querying the warehouse.
The third phase was an idea, in his words, “that hits you when you’re sleeping at 3 AM.” DataHub provides AI context to applications, but the AI engineering stack itself (vector databases and agent frameworks) does not surface its own context back into DataHub. He set out to build a Pinecone connector to close that loop.
He did not have hands-on experience with the DataHub codebase. DataHub Skills filled that gap. Plugged into his IDE as an agentic framework loaded with DataHub conventions, the framework let him work through the engineering cycle with prompts and clarity rather than memorized internals. Tamás Németh, one of the DataHub maintainers, stayed with him along the way — the kind of back-and-forth help that does not show up in commit history but turns a stalled connector into a shipped one. The Pinecone connector landed.
JARS is now contributing back to DataHub Skills GitHub itself, improving the framework that taught him how to contribute.
“Come with curiosity, ideas, intention, clarity. The experience will be sorted out by the community.”
Jishanahmed ShaikhEngineering, PassionBytes
JARS’s journey is exactly what an open-source project hopes for: a practitioner who used the tools, found the gaps, asked for help, shipped the work, and kept giving back. If you have a connector idea sitting in a notebook somewhere, or a 3 AM thought about extending DataHub into your own corner of the stack, bring it to the DataHub Slack. That is where the conversations start.
Join the DataHub community
This town hall covered three patterns that are starting to converge: Pinterest using DataHub as the context substrate for production AI agents, Omni cataloging its semantic layer alongside the rest of the data ecosystem, and the open-source DataHub Analytics Agent putting the same context platform to work for everyone.
The thread connecting them is straightforward: once context is centralized, everything that touches it gets better.
A few ways to keep going from here:
- Watch the full town hall recording for the live demos and the parts the recap could not capture
- Read the Pinterest case study to learn more about how they went from 400,000 ungoverned tables to an analytics agent that has 10x the usage of their next-best AI tool
- Read the launch blog for the reasoning behind the DataHub Analytics Agent and the repo to deploy it
- Browse the DataHub integrations index — Omni, Pinecone, and the warehouses underneath everything in this town hall live here
- Try the DataHub Skills toolkit if you want to build connectors or contribute back like Peter and JARS did
- Sign up for the next town hall — Pinterest, Omni, and JARS all came through this same community
The next contributor’s story starts in the same place this one did.