Data Observability Platform for End-to-End Data Trust

Your engineers shouldn’t have to firefight data quality issues. DataHub Cloud delivers automated monitoring and instant root cause analysis. Catch issues before dashboards break, not after tickets pile up.

From firefighting to prevention in one platform

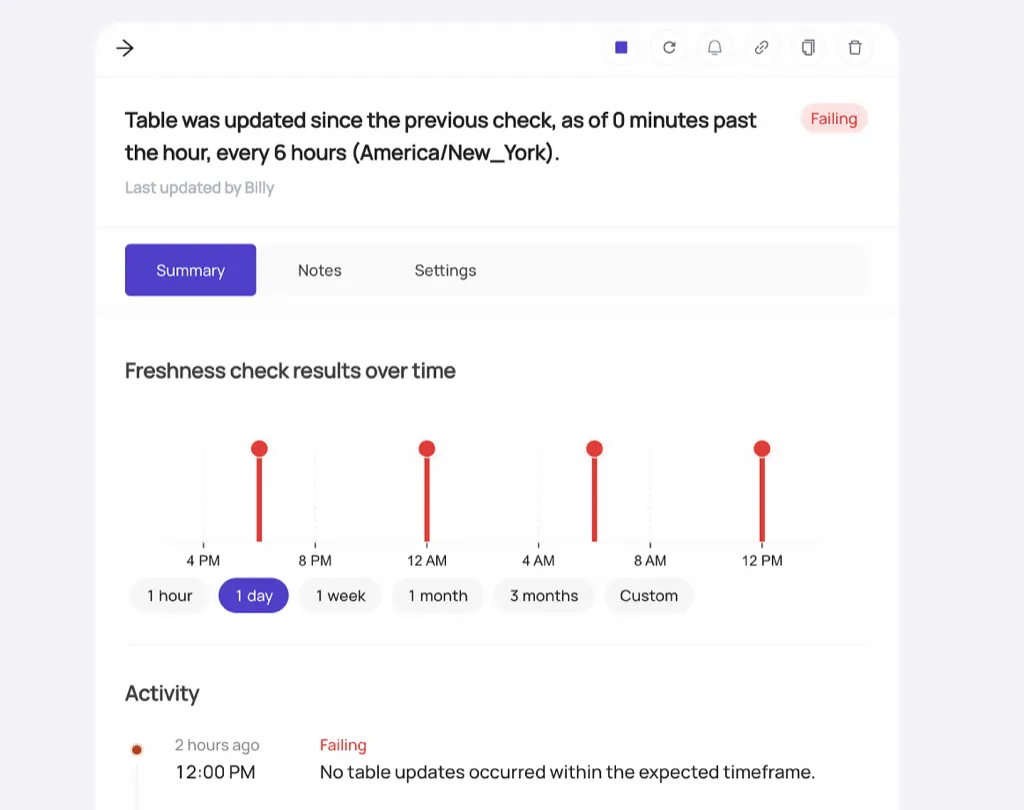
Proactively monitor data quality

Define schema, freshness, volume, and custom quality checks that run automatically across hundreds of columns. Smart alerts fire to owners when data deviates from expected patterns with complete lineage and suggested actions that accelerate resolution.

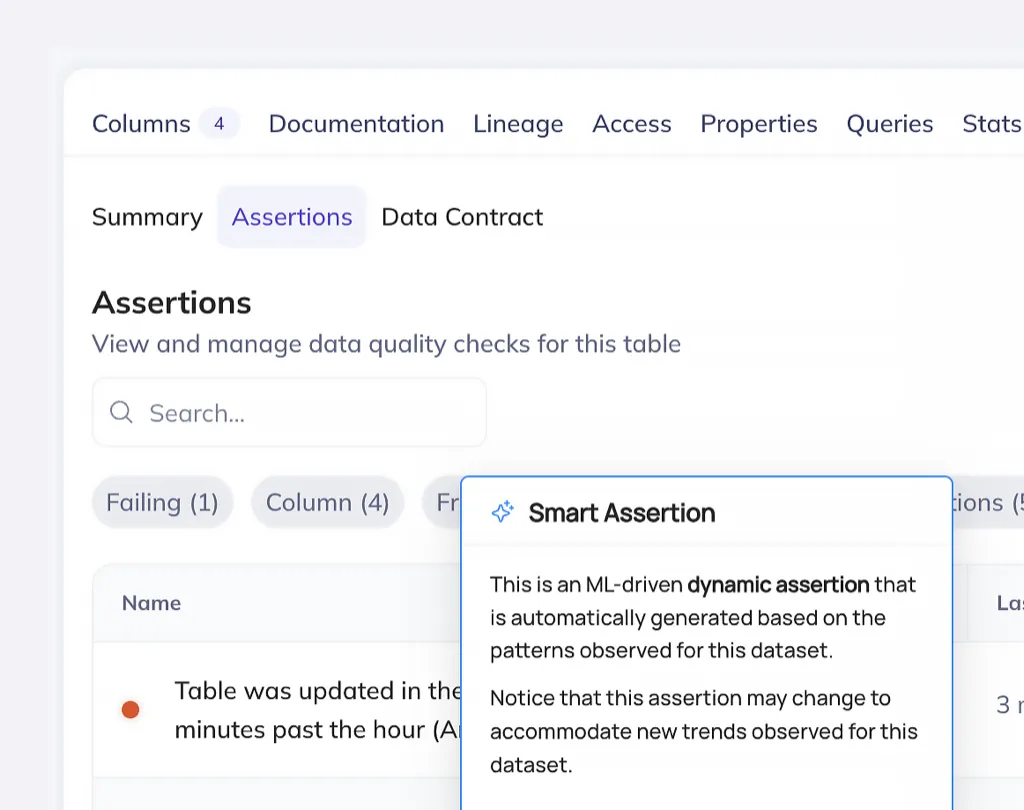
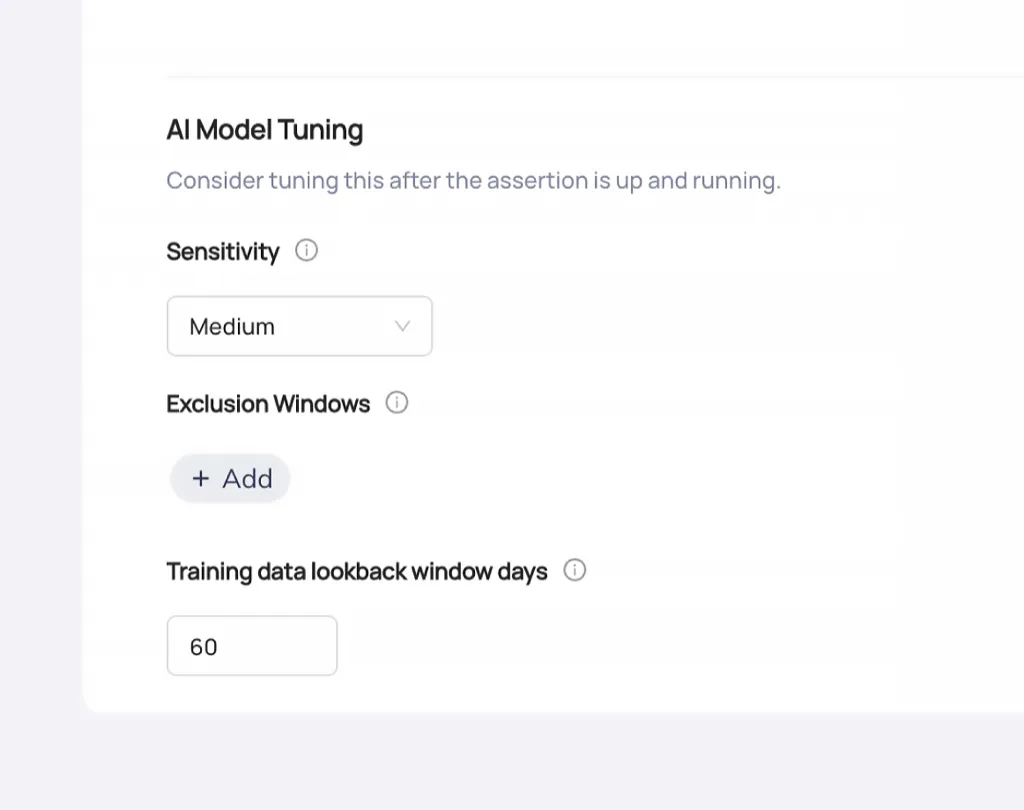
Detect anomalies with AI

ML-powered anomaly detection spots unexpected patterns in data volume, distribution, and quality metrics. Machine learning models identify issues that rule-based checks miss.

Track incidents from detection to resolution

Built-in workflows manage incidents end-to-end. Historical patterns, schema changes, and quality trends surface root causes in minutes instead of hours of investigation.

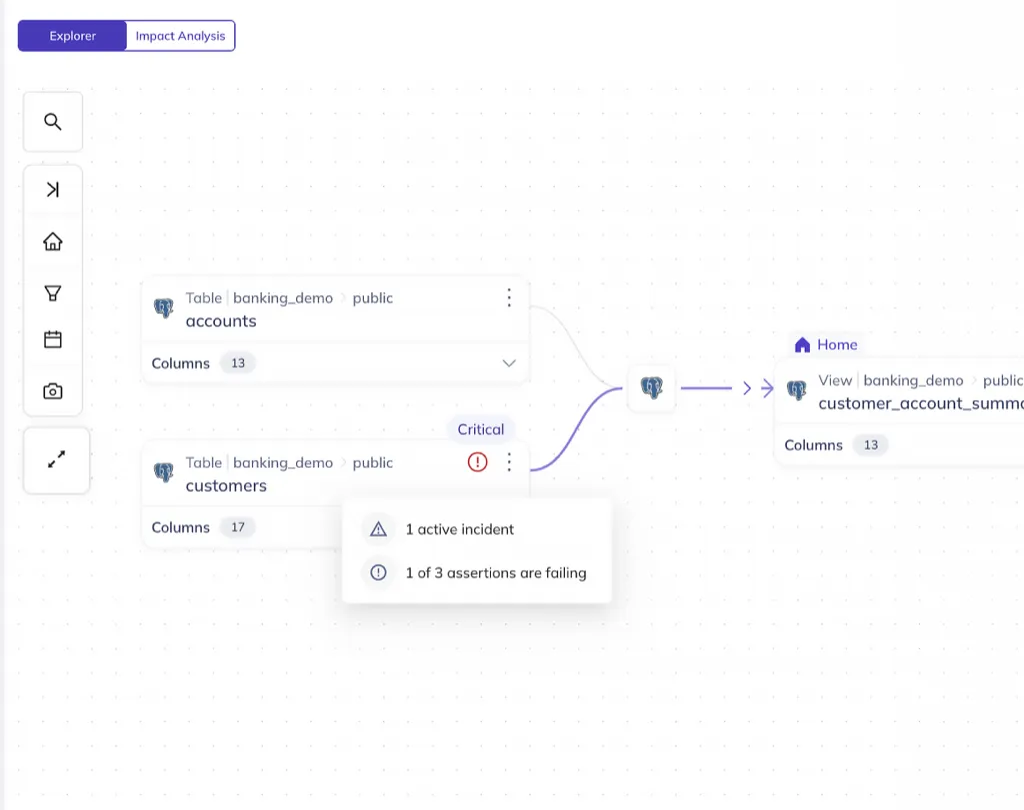
Know what breaks when upstream data changes

Column-level lineage traces data flow from source to dashboard. Blast radius analysis shows exactly which models, reports, and teams are affected the moment upstream data shifts.

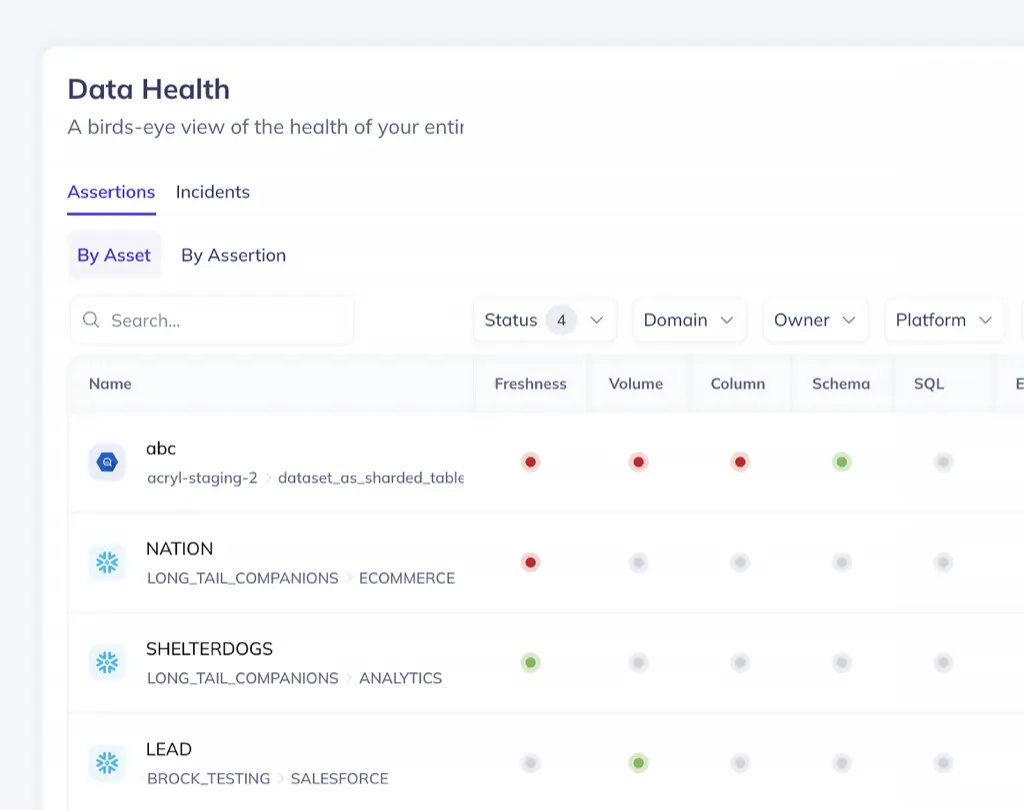
See data health scores across your entire stack

Quality scores show freshness, completeness, and accuracy for every table at a glance. Track SLA compliance and prioritize datasets that need attention without manual status checks.

How teams use DataHub to eliminate data incidents

Data analysts can trust dashboards without data team verification

Freshness monitors and certification badges identify which datasets are production-ready without engineer verification.

Data engineers reduce breaking changes from weekly to zero

See downstream impact across the entire pipeline. Alerts notify affected teams before changes merge so you coordinate proactively.

Data scientists verify data provenance in seconds, not hours

Column-level lineage connects model and feature pipelines to source data so data scientists verify provenance and track transformation.

Real data observability results from enterprise teams

MYOB eliminates breaking changes

“Before bringing DataHub on board, our data teams would see multiple breaking changes per week. Since integrating DataHub into our workflow … DataHub has helped us significantly reduce the number of breaking changes, to the extent that they are no longer a burden on all teams.”

ASAD NAVEED
Engineering Manager, MYOB

CHALLENGE

Managing complex dependency trees across thousands of transformations caused multiple breaking changes per week.

SOLUTION

Implemented DataHub to provide critical data observability insights and automatically notify downstream data consumers before changes merge.

IMPACT

Eliminated breaking changes, reducing incidents from multiple per week to zero.

Built to meet enterprise observability requirements

Proactive monitoring and ML-powered detection
  • Detect issues before dashboards or AI applications break
  • Monitor thousands of tables with one-click bulk creation
  • Notify owners automatically when anomalies are detected
  • See complete blast radius with column-level lineage
Enterprise performance
  • Real-time monitoring across billions of records
  • AI data quality checks across hundreds of columns
  • End-to-end platform visibility
  • Multi-cloud deployment support
Security and extensibility
  • 100+ pre-built connectors
  • Role-based access controls
  • SOC 2 Type II certified infrastructure
  • Comprehensive API documentation

Ready to turn reactive firefighting into proactive monitoring?

Reactive troubleshooting doesn’t have to be your default.

DataHub Cloud delivers automated monitoring and instant impact analysis that prevent breaking changes before they reach production.

Let us show you how it works. Book a demo.

FAQs

Data observability tools monitor pipelines to catch quality issues before they break downstream dashboards and reports. They validate data continuously through automated assertions that detect freshness delays, schema changes, and data anomalies.

Modern observability platforms (like DataHub) show upstream and downstream dependencies through column-level lineage—so root cause analysis can trace incidents from broken dashboards back to the source tables or transformations that introduced bad data. Real-time alerts notify teams immediately instead of waiting for users to discover failures through incorrect reports.This shifts teams from firefighting incidents to preventing them. Organizations like Miro and Notion use DataHub’s data quality monitoring to catch issues faster and build trust in reliable data through continuous validation that stops data quality problems from propagating through pipelines.

Data observability tools monitor pipelines continuously to catch quality issues before they break downstream dashboards and reports. DataHub’s unified platform provides additional data reliability advantages that standalone data observability tools can’t match:

  • Quality signals show up in discovery: Assertion results, quality scores, and freshness indicators appear alongside data assets—so analysts assess reliability when selecting datasets instead of discovering issues after building reports.
  • Automated checks catch problems early: Continuous assertions detect null rate spikes, row count anomalies, and schema changes before they break dashboards. Data Contracts enforce quality SLAs by detecting violations in real time and alerting teams immediately.
  • Lineage traces incidents to the source: Column-level dependencies map incidents from broken dashboards back to source tables or transformation logic. Real-time Slack and email alerts surface issues immediately.

DataHub’s unified platform means data observability also informs data discovery decisions and enforces data governance policies instead of operating as a separate tool.

DataHub delivers actionable data insights that answer what broke, why it matters, who’s affected, and what to do next—not just “something failed.”

  • See who’s impacted before you triage: Alerts show which dashboards, models, and reports depend on failed assets—so you prioritize fixes based on business impact instead of guessing blast radius.
  • Trace failures to the source: Column-level lineage maps failures upstream to source tables and transformation logic while showing actual versus expected values—eliminating the detective work to understand why pipelines broke and what’s impacted.
  • Connect to the right people immediately: Smart alerts identify dataset owners and domain experts automatically—so on-call engineers reach subject matter experts who can fix issues instead of broadcasting in Slack or Teams.

Teams resolve incidents in seconds instead of hours, or days because alerts contain diagnostic context needed to fix problems instead of just signaling something went wrong.

DataHub unifies discovery, observability, and governance in one platform—eliminating the tool-switching and integration work that fragments data operations across point solutions. 

Teams work from shared context where finding data, validating quality, and enforcing policies happen in one place instead of switching between tools across your data stack. This speeds up incident response and keeps operational knowledge centralized instead of scattered across disconnected systems. Take the DataHub product tour to see it in action.

Yes. DataHub monitors data quality across your entire lineage graph—detecting incidents in upstream and downstream dependencies automatically.

  • See health status across connected assets: Viewing any dataset shows quality status from connected assets—revealing which upstream tables have freshness delays or schema changes that will break downstream dashboards before failures cascade.
  • Catch problems before they reach production: Lineage queries reveal issues several hops away from the asset you’re investigating—catching problems in source systems before they propagate to the reports and models analysts use.
  • Track incidents across the complete dependency chain: When assertions fail, DataHub traces impact across all affected reports, models, and datasets while tracking resolution status—so you see what’s broken and what’s fixed in real time.

This compresses incident resolution from hours or days to minutes by following quality issues from broken dashboards back through transformations to the source tables where problems started.

DataHub prevents alert fatigue through intelligent filtering and centralized triage that replaces notification floods with actionable signals:

  • Subscribe to alerts you actually care about: Subscribe to specific assertion types and individual datasets instead of receiving every quality event—so analysts only see alerts for tables they own or depend on.
  • Reduce false positives with adaptive detection: Smart Assertions learn patterns and adapt to trends automatically. Tune sensitivity, exclude maintenance windows, adjust lookback periods, and mark expected changes as normal to reduce noise. Document assertion logic so teams understand what’s monitored and how to fix failures.
  • Triage incidents in one place: The Data Health Dashboard provides filtered views by status, time range, and ownership—so teams investigate incidents in one interface instead of parsing email threads.

This ensures engineers receive signals that require action instead of noise that trains teams to ignore alerts

Yes. DataHub integrates with monitoring and incident management platforms through 100+ integrations and extensible APIs. DataHub routes data quality incidents and alerts to Slack, email, and webhooks—so observability signals reach teams through the channels they already monitor.

This eliminates switching between separate data quality dashboards and the incident management workflows engineering teams use for production systems.

Yes. DataHub monitors both streaming and batch pipelines through unified metadata collection and execution tracking.

Native integrations with Airflow, Spark, and dbt capture lineage, execution status, timing metrics, and failures automatically—whether data flows through scheduled batch jobs or event-driven streams.

Engineers investigate pipeline failures through unified lineage views that connect Kafka streams to downstream batch aggregations without switching between platform-specific monitoring tools.

DataHub surfaces business-critical issues through structured incident management and impact analysis:

  • Triage by severity automatically: Four severity levels (Critical, High, Medium, Low) rank incidents with the highest priority first—focusing engineering attention on issues affecting critical dashboards or production models before lower-impact problems.
  • See who’s affected before you prioritize: Cross-platform data lineage shows which reports, datasets, and teams depend on failed assets, so you prioritize fixes based on actual business impact instead of alert volume.
  • Track incidents by type and stage: Issues categorized by type (freshness, volume, schema, operational) and lifecycle stage (triage, investigation, in progress) help teams route incidents to appropriate owners and track resolution progress.

The Data Health Dashboard consolidates these signals into filtered views by priority, status, and ownership—eliminating manual investigation to understand which issues need immediate attention versus which can wait.

Yes. DataHub classifies severity through multiple layers that separate business-critical failures from minor issues:

  • Rank incidents by business impact: Four priority levels (Critical to Low) ensure failures affecting production dashboards trigger immediate response while minor anomalies in exploratory datasets queue for investigation.
  • Tune detection per dataset: Sensitivity controls adjust thresholds by dataset—enabling strict validation for executive reports while allowing natural variance in experimental pipelines.
  • Choose how to handle each issue: Define whether issues automatically raise incidents with notifications or simply log results for review—preventing alert fatigue by distinguishing critical failures from minor degradation worth tracking over time.

Human review workflows let engineers confirm or reject detected anomalies, training the system to recognize legitimate variance versus actual quality problems.

Additional Resources