What is Data Observability? A Complete Guide for Data Teams
The average data incident may take days to detect and resolve. Days of scrambling through Slack threads, opening multiple tools, tracing lineage manually, and hunting down dataset owners. Days during which dashboards show wrong numbers, executives make decisions on bad data, and your team’s credibility erodes. Take what happened at Unity Software in May 2022 (Nasdaq). They discovered they’d been ingesting bad data from a large customer, leading to a 30% stock plunge and $110 million in lost revenue.
But here’s the thing: Most data incidents don’t make headlines. They happen quietly, repeatedly, across organizations every day. In those cases, the real cost is an invisible tax: Data teams stuck in firefighting mode, business users who stop trusting the data, delayed decisions, and the growing reluctance to invest in data initiatives that can’t guarantee reliability.
The root cause of these problems? Fragmentation. When an incident occurs, you need to open your monitoring tool to see what broke, switch to your catalog to find the owner, check your lineage tool to understand impact, and ping Slack to figure out who’s actually affected. By the time you’ve assembled the full picture, days or weeks have passed, and trust has been damaged.
Data observability emerged to solve this problem, to detect issues faster and provide the context needed to understand, resolve, and prevent data incidents in minutes instead of days. However, not all observability solutions deliver on this promise. Unlike DataHub, many point solutions only monitor data health and leave teams switching between tools to assemble context during incidents, perpetuating the very fragmentation problem they’re meant to solve.
What is data observability?
Quick definition
Data observability is the ability to understand the health and state of data throughout its lifecycle—providing not just alerts when something breaks, but the full context needed to diagnose root causes, assess business impact, and resolve issues rapidly.
At its core, data observability enables you to answer five critical questions when something goes wrong:
- What broke? (The specific dataset, column, or pipeline)
- Why did it break? (Root cause analysis)
- Who’s affected? (Downstream dependencies and their owners)
- How bad is it? (Blast radius and business impact)
- How do we prevent this? (Pattern recognition and preventive measures)
The unique challenges of data observability
Data observability borrowed concepts from DevOps and site reliability engineering, where observability has been standard practice for years. But data presents unique challenges that limit the comparison:
- Unlike applications, data constantly changes in shape, volume, and meaning. An app that crashes affects users immediately—everyone knows something is wrong. Data that goes bad can operate silently for weeks before anyone notices a discrepancy in a dashboard. When your revenue figures are off by 15%, was it a data quality issue that happened yesterday, or has it been wrong for three weeks?
- Data also has lineage complexity that applications don’t face. A single upstream schema change can cascade through dozens of transformation jobs, break multiple dashboards, degrade ML model performance, and impact teams across the organization. Tracing these dependencies manually during an incident wastes precious time.
- The shape is different. Application observability tracks system performance metrics—response times, error rates, resource utilization. Data observability monitors completely different dimensions that require human context:
- Consistency (does data match across systems?)
- Completeness (is anything missing?)
- Accuracy (is it correct?)
- Uniqueness (are there duplicates?)
- Timeliness (is it current?)
- Validity (does it conform to rules?)
Data pipelines also present unique operational challenges. Jobs are long-running and highly interdependent; a single upstream transformation failure can cascade through dozens of downstream dependencies over hours or days. Unlike microservices that fail fast and obviously, data issues can persist silently while appearing operationally successful, making detection far more complex than monitoring application health metrics.
The key benefits of data observability
Here are the key benefits of data observability:
- Instead of learning about issues when executives question dashboard numbers, you detect data anomalies before they reach downstream consumers—preventing scenarios like dynamic pricing models that start issuing massive discounts due to bad data inputs, potentially costing millions in lost revenue
- Instead of spending hours tracing root causes and figuring out who to contact, you see the full lineage, ownership, usage, and impact analysis immediately
- Instead of preventing future incidents through institutional knowledge and manual reviews, you build automated safeguards based on data patterns
The most effective data observability tools unify these capabilities in a single system. Rather than adding another point solution to your stack, unified platforms like DataHub connect observability with discovery and governance, ensuring teams have everything they need to resolve incidents without switching tools. This architectural approach is what enables cutting resolution time from hours to minutes.
Data observability vs. monitoring, testing, and quality
The data management landscape includes several overlapping practices and terms that sound similar but serve very different purposes. Understanding how data observability relates to monitoring, testing, quality, and governance helps clarify where it fits in your stack.
Data observability vs. data monitoring
Key difference: Monitoring reports metrics. Observability provides diagnosis.
Example:
- Data monitoring tells you that Table X has 50,000 rows at 9am.
- Data observability tells you that Table X usually has 1 million rows at 9am, today’s 50,000 represents a 95% drop, this impacts 12 downstream dashboards used by the finance team, and the root cause traces to an upstream API change deployed yesterday by the engineering team.
Monitoring is necessary but insufficient. Without the diagnostic context that observability provides, you’re still running a manual investigation across multiple tools to assemble the complete picture.
Modern data observability platforms layer context-rich insights on top of monitoring data. When an alert fires, you immediately see lineage showing downstream impact, ownership information showing who to notify, recent changes showing potential causes, and historical patterns showing whether this is an anomaly or expected behavior.
Data observability vs. data testing
Key difference: Testing catches known unknowns. Observability catches unknown unknowns.
Example: Data testing involves writing explicit checks for conditions you anticipate, such as:
- Revenue should never be negative
- Email addresses must match a specific format
- Foreign keys must have corresponding records in the parent table.
These tests are valuable for catching issues you’ve seen before or can predict..
But data pipelines break in ways you don’t anticipate, e.g.:
- A third-party API changes its JSON schema structure without warning, suddenly generating 500,000 rows instead of the usual 50,000
- Your user_id column starts showing 15% NULL values when it historically had less than 1%
- A timestamp field shifts from UTC to local time zones, breaking every downstream time-series analysis.
None of these scenarios triggered your existing tests because you didn’t know to write tests for them. They’re unknown unknowns—problems you discover only after they’ve already impacted production.
Data observability fills this gap through proactive profiling, and ML-powered anomaly detection that learns normal patterns in your data and surfaces deviations automatically. You don’t need to predict every possible failure mode and write tests for them. The system monitors volume, distribution, column metric, freshness, and schema changes continuously, alerting when patterns shift unexpectedly.
Data observability vs. data quality
Key difference: Data quality describes the outcome. Data observability provides the tools to achieve it.
Data quality refers to the state of your data across several dimensions:
- Accuracy (is it correct?)
- Completeness (is anything missing?)
- Consistency (does it match across systems?)
- Timeliness (is it current?)
- Validity (does it conform to rules?)
- Uniqueness (are there duplicates?)
These are the goals. Data observability is how you measure progress toward those goals and maintain them over time.
You can achieve momentary high-quality data through manual cleanup efforts and batch validation. But without continuous observability, quality degrades silently until the next manual review. Data observability monitors these quality dimensions continuously, catching degradation immediately and enabling rapid remediation.
The most effective approach combines automated quality checks with comprehensive lineage. When quality degrades in an upstream dataset, lineage immediately shows you which downstream reports and models are affected, allowing you to contain the impact and prioritize fixes based on business criticality.
Data observability vs. data governance
Key difference: Governance sets the rules. Observability provides enforcement and evidence.
Data governance establishes policies about:
- Who owns what data
- Which datasets are certified for specific use cases
- What information is sensitive and requires access controls
- Which standards must be maintained for compliance
These policies only work if you can monitor compliance continuously and surface violations quickly. Data observability monitors adherence to governance standards in production—not just during periodic audits—and provides the audit trail needed to demonstrate compliance.
Example:
- Governance might require that Personally Identifiable Information (PII) fields are masked in non-production environments, critical datasets are certified before use in executive reporting, and data freshness SLAs are maintained for customer-facing applications.
- Observability monitors these requirements continuously, alerting when violations occur and maintaining historical records of compliance status.
Why you need all of these practices
Data observability isn’t either/or with the practices of data monitoring, testing, quality management, or governance. You need all of these practices working together. The challenge is making them work together at scale. This is where unified platforms, like DataHub, provide an architectural advantage. When observability, discovery, and governance share the same metadata foundation:
- Policies can be enforced automatically based on detected data characteristics
- Quality improvements can be prioritized based on usage patterns
- Smart assertions and bulk column monitoring apply validation across multiple datasets with flexible scope
- Users receive recommendations for governance-compliant datasets
- Incident response happens in the same interface used for discovery and governance
Data observability becomes the connective tissue that makes these practices effective at enterprise scale, providing continuous visibility, automated detection, and rapid incident response without fragmenting your team’s workflow across multiple tools.
“The most mature data teams we work with don’t think about observability as separate from discovery or governance. They understand these capabilities reinforce each other—lineage helps you understand quality impact, usage patterns inform governance priorities, and quality metrics guide discovery recommendations. That integration is what scales.”
– John Joyce, Co-Founder, DataHub
Traditional data observability frameworks vs. a focus on business outcomes
Traditional data observability frameworks focus on monitoring five technical dimensions:
- Freshness (is data up-to-date?)
- Volume (is data complete?)
- Schema (has structure changed?)
- Distribution (are values valid?)
- Lineage (how does data flow?)
While monitoring these dimensions is foundational, mature data teams have evolved beyond component-focused monitoring to think about observability in terms of business outcomes. The question isn’t just “what metrics should we track?” but “how do we build and prove data trust across the organization?”
DataHub approaches observability through three phases that align with how customers actually adopt and derive value:
- Detection (catching issues before business impact)
- Resolution (accelerating root cause analysis and coordination)
- Reporting & Governance (proving reliability and driving continuous improvement)
This outcome-oriented framework acknowledges that technical monitoring is necessary but insufficient—what matters is whether you can prevent business impact, resolve incidents rapidly, and demonstrate trustworthiness to stakeholders.
The three phases of data observability: From detection to trust
Effective data observability is about building data trust across your organization. DataHub structures observability around three phases that map to how teams actually adopt and derive value from the platform.
Phase 1: Detection – Catch issues before business impact
Detection answers the urgent question every data team faces: “How do we know when something breaks before executives notice wrong numbers in dashboards?”
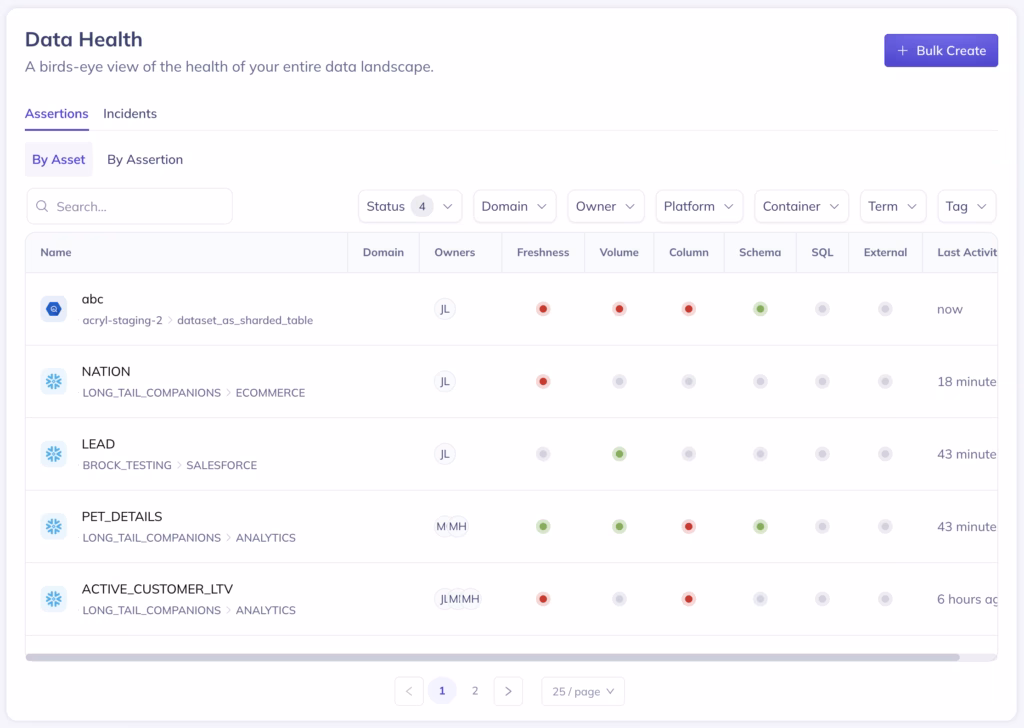
Early detection requires monitoring across multiple dimensions simultaneously:
- Freshness: Is data updating on expected cadence? If your executive dashboard should refresh hourly but hasn’t updated in six hours, you have a freshness problem.
- Volume: Are pipelines processing complete data? A sudden drop from 1 million rows to 50,000 typically indicates an upstream break or incomplete load.
- Schema: Have table structures changed unexpectedly? Column renames and type changes cascade through transformation logic, breaking dashboards and ML models.
- Distribution and validity: Is the data garbage even if pipelines look fine? NULL percentages spiking from 1% to 30%, or revenue values suddenly going negative, indicate quality issues that operational metrics miss.
- Patterns and anomalies: Are values deviating from learned norms? ML-powered detection catches issues you didn’t anticipate and wouldn’t write explicit tests for.
Detection is where most teams start their observability journey because it addresses the most urgent pain: Data incidents that erode trust and impact business outcomes. When implemented well, detection shifts teams from reactive firefighting (“why are these dashboard numbers wrong?”) to proactive prevention (“we caught and fixed the issue before anyone downstream noticed”).
Key capabilities for effective detection:
- Assertion-based validation that runs continuously without manual intervention
- ML-powered anomaly detection that learns patterns and reduces false positives
- Smart alerting that routes notifications to the right owners with context
- Full coverage of critical datasets, from the raw data inputs, through the warehouse’s transformation layers, all the way down to the final data products
What success looks like:
- Teams shift from learning about issues when executives question dashboard numbers to catching problems before downstream impact
- Alert fatigue decreases as ML-powered detection reduces false positives
- Data engineers spend less time responding to “why is this dashboard wrong?” Slack messages and more time on strategic improvements
Partial observability creates blind spots that let incidents slip through. You need comprehensive detection across freshness, volume, schema, and distribution to catch both operational failures and data quality issues. But detection alone isn’t enough—without the context to resolve incidents quickly and the reporting to prove improvements, teams stay stuck in firefighting mode. All three phases work together: detection catches issues, resolution fixes them fast, and reporting drives continuous improvement.
Phase 2: Resolution – Accelerate root cause analysis and coordination
Detection tells you something broke. Resolution gets it fixed. Fast.
When an alert fires, responders face critical questions: What broke? Why did it break? Who’s affected? How bad is it? How do we fix it? Answering these questions traditionally meant opening monitoring tools, switching to catalogs to find owners, checking lineage tools to understand impact, and hunting through Slack threads to coordinate response. This tool-switching wastes precious time during incidents.
Resolution requires unified context that brings together:
- Column-level lineage: Not just “Table A feeds Table B” but “column_x in Table A feeds column_y in Table B, which powers the Revenue by Region metric the CFO reviews daily.” This granularity transforms incident response from hours of detective work to seconds of clear visibility.
- Ownership and usage metadata: Rich ownership and usage metadata across assets allows you to quickly determine who to escalate to when an incident stems from an upstream source. For impact management, it reveals not only which dashboards are affected, but also who is impacted by them.
- Recent changes: What deployments, schema modifications, or configuration changes occurred before the incident? Context about recent activity accelerates root cause identification.
- Impact analysis: Which downstream dashboards, reports, and ML models are affected? Which teams and stakeholders need notification? How important are these assets? Understanding blast radius helps prioritize remediation.
- Incident management workflows: Structured tracking from detection through resolution ensures problems get fixed, root causes are documented for future engineers and AI agents to leverage, and patterns get identified for prevention.
DataHub’s architectural advantage for resolution
Most observability tools are point solutions focused solely on detection. They alert you when something breaks, then leave you switching between catalogs, lineage tools, and documentation systems to assemble the context needed for resolution. This fragmentation is exactly what causes incidents to take days instead of minutes.
DataHub unifies observability with discovery and governance in a single platform. When an alert fires, the same interface provides comprehensive lineage, dataset ownership, relevant documentation, quality trend history, and recent changes, all without opening separate tools or hunting through Slack threads. This unified metadata layer is what enables cutting resolution time from hours to minutes.
Key capabilities for effective resolution
- Column-level lineage showing precise downstream impact
- Cross-platform lineage from source data through transformations to BI dashboards and ML models
- Ownership information with automated routing
- Incident management tracking status, root causes, and resolution time
- Integration with communication tools (Slack, Teams) for coordination
What success looks like
- Mean time to resolution (MTTR) drops from days or hours to minutes
- Data engineers spend less time manually tracing lineage and hunting down owners
- Incidents are documented with root causes and resolutions, building institutional knowledge and unlocking self-healing data quality with AI agents
- Teams shift from reactive firefighting to strategic data quality improvements
Phase 3: Reporting & Governance – Prove reliability and drive continuous improvement
Detection catches issues. Resolution fixes them. Reporting proves your data platform is trustworthy and secures investment for continuous improvement.
Once you’ve resolved incidents faster and prevented downstream impact, you need to demonstrate value to leadership, data consumers, and adjacent teams. Quantified improvements build organizational confidence in data initiatives and secure resources for broader implementation; expanded observability coverage, preventative strategies, and scaled governance programs.
Reporting enables the virtuous cycle
Generate reports showing:
- Mean time to detection (MTTD) and resolution (MTTR) improvements
- Prevented incidents caught before impacting business users
- Reduction in data-related support tickets and escalations
- Coverage of critical assets with automated monitoring
- Compliance with data quality SLAs and governance policies
- Time saved by data teams (hours previously spent firefighting)
- Increased data trust scores from business stakeholders
These metrics create a compelling business case for continued investment. Teams that demonstrate clear ROI find it easier to justify headcount, tooling budgets, and strategic data quality initiatives.
Governance integration
As observability matures, it becomes the enforcement mechanism for governance policies:
- Automated compliance monitoring: Track whether PII fields are properly masked, critical datasets are certified before use, data contracts are established, and SLAs are maintained
- Audit trails: Maintain historical records of quality status, incidents, and resolutions for compliance requirements
- Proactive prevention: Use incident patterns to identify chronic issues requiring architectural fixes rather than repeated manual interventions
- Quality-driven discovery: Surface governance-compliant, high-quality datasets in discovery interfaces, steering users toward trusted data
Key capabilities for reporting and governance
- Customizable dashboards showing quality metrics and trends
- SLA tracking and compliance reporting
- Incident analytics identifying patterns and chronic issues
- Integration with governance frameworks and certification workflows
- Historical tracking for audit requirements
- Data contracts
What success looks like
- Leadership increases investment in data initiatives based on demonstrated reliability improvements
- Data consumers trust the platform enough to make confident decisions
- Governance policies are enforced automatically rather than through periodic manual audits
- The organization shifts from questioning data quality to leveraging data as a strategic asset
The architecture of modern data observability
Enterprise-grade data observability requires specific architectural components that enable scale, automation, and unified workflows. Understanding these components helps distinguish comprehensive platforms from point solutions.
Event-driven architecture
Real-time metadata processing is foundational to effective observability. Batch-based systems that collect metadata nightly or hourly create dangerous gaps where issues go undetected.
Event-driven architectures process metadata changes as they occur. When a table is created, updated, or queried, that event is captured and processed immediately. This enables low-latency alerting and keeps your view of the data landscape current even in high-velocity environments.
Enterprise environments routinely process billions of metadata events daily across hundreds of thousands of data assets. Platforms built on event-driven architectures scale to this volume without degradation. This is critical for AI applications where training pipelines and inference services generate continuous metadata events.
Assertion-based validation
Assertions define data quality checks once and run them continuously without manual intervention—checking schema conformance, freshness thresholds, volume ranges, and custom business logic on your schedule (hourly, daily, or triggered by events like pipeline completion). When assertions fail, alerts route to designated owners with full context.
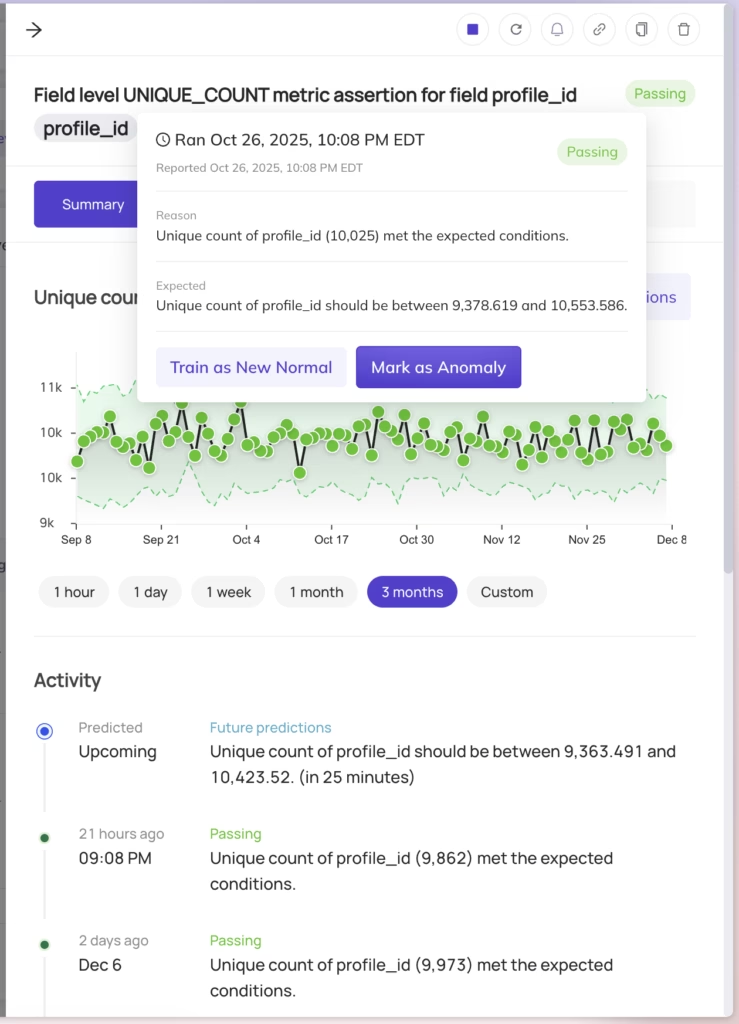
ML-powered anomaly detection
Rule-based checks catch known failure modes. Machine learning catches patterns you didn’t anticipate.
Anomaly detection systems learn historical patterns (like typical volumes, freshness cadences, seasonal trends) and surface deviations that fall outside learned norms. This reduces false positives while catching subtle issues that fixed rules miss.
Example: A retail company’s transaction volumes spike every November for Black Friday. A fixed threshold would either fire constantly during the spike (false positive) or miss a 20% drop (false negative). ML-based detection learns the seasonal pattern and alerts only when volumes deviate from the expected November behavior.
Bulk column monitoring applies validation across hundreds of columns simultaneously. Rather than creating individual checks for each column, smart assertions monitor NULL percentages, uniqueness, and distribution patterns across multiple columns with a single configuration.
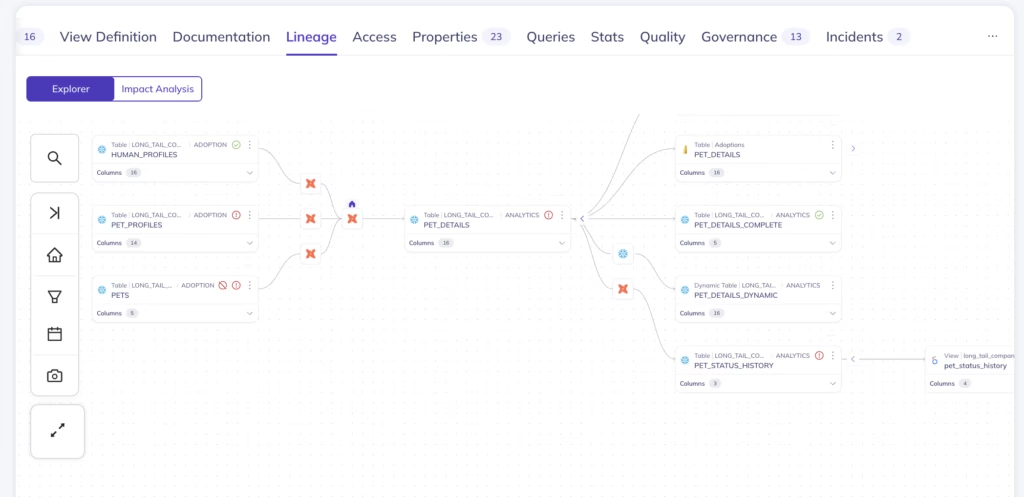
Column-level lineage as the secret weapon
Table-level lineage tells you “Table A feeds Table B”—useful, but insufficient during incidents. Column-level lineage shows that column_x in Table A feeds column_y in Table B, which feeds column_z in Table C that powers the “Revenue by Region” metric viewed by the CFO.
This granularity transforms incident response from hours of detective work to seconds of clear visibility. When a schema change affects column_x, you immediately see the blast radius: specific downstream columns, specific dashboards, specific business owners.
Cross-platform lineage provides end-to-end visibility beyond individual tools. Trace data flow from raw events in Kafka through transformation logic in dbt, through aggregation in Snowflake, to visualization in Looker. When something breaks, you know whether the issue originated in source data, transformation logic, or warehouse processing.
Unified metadata layer
During incidents, you need lineage, ownership, documentation, quality history, and recent changes—all accessible immediately. Tool-switching wastes time and breaks context.
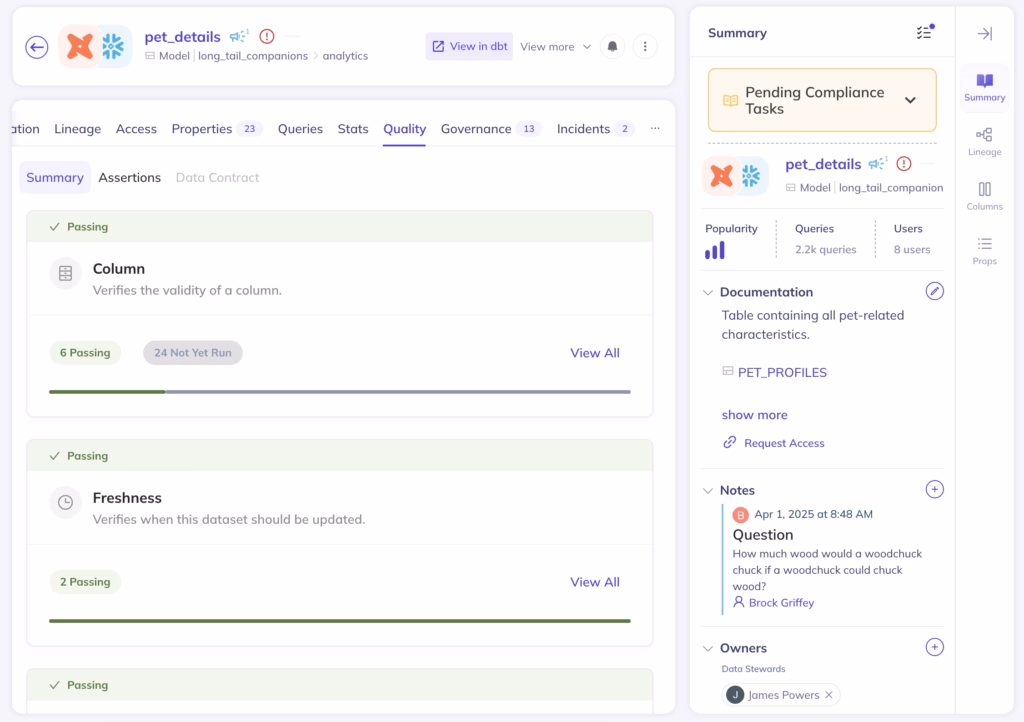
Unified platforms connect observability to broader data management context. When an alert fires, the same interface shows comprehensive lineage, dataset owners, relevant documentation, quality trend history, and recent schema changes—without opening separate tools or hunting through Slack threads.
This unified metadata layer enables integrated workflows: Lineage information helps assess quality impacts, governance policies apply automatically based on detected sensitivity, quality improvements align with usage patterns, and users receive recommendations for governance-compliant assets.
This unified metadata layer enables integrated workflows: Lineage information helps assess quality impacts, governance policies apply automatically based on detected sensitivity, quality improvements align with usage patterns, and users receive recommendations for governance-compliant assets.
Point solutions solve observability in isolation, leaving you to manually assemble context from multiple systems. Unified platforms provide everything you need to understand, communicate, and resolve issues in one place—cutting resolution time from hours to minutes.
How do you implement data observability?
Moving from concept to practice requires a strategic approach that delivers value quickly without overwhelming your team. Start small, prove impact on critical data, then expand coverage systematically.
1. Start with business-critical data
Attempting to monitor every dataset simultaneously leads to alert fatigue and stalls adoption. Apply T-shaped monitoring instead: foundational health checks across all data, deep observability on what matters most.
The T-shaped approach consists of:
- Horizontal bar: Monitor freshness and basic volume checks across your entire data warehouse
- Vertical bars: Apply deep monitoring—schema validation, distribution checks, custom business logic—to critical datasets that power executive dashboards, customer-facing applications, revenue reporting, and ML models
Identify your 20% of data that drives 80% of business decisions. Ask these questions:
- Which tables feed executive dashboards reviewed in leadership meetings?
- Which datasets power customer-facing applications or product features?
- Which pipelines have caused incidents in the past six months?
- Which data sources would halt business operations if they failed?
Platforms that automatically surface popular datasets based on query patterns and usage metadata can accelerate this discovery process. If a table receives 10,000 queries per month from 50 different users, it’s probably business-critical.
2. Establish baselines and SLAs
Effective monitoring requires knowing what “normal” looks like for each critical dataset.
Document expected patterns:
- Freshness: This table updates every hour at 15 minutes past the hour
- Volume: Daily row counts typically range between 900,000 and 1.1 million
- Schema: These 12 columns are required; these 3 are optional
- Distribution: NULL percentage for email_address should stay below 2%
Define service level agreements that codify acceptable thresholds. Track SLA compliance over time to measure improvement and demonstrate reliability gains to business stakeholders.
3. Set up automated assertions
Manual quality checks don’t scale. Automated assertions run continuously without human intervention, catching issues immediately.
Configure core checks for critical datasets:
- Schema validation: Monitor column additions, deletions, type changes, and constraint modifications. Alert when schemas deviate from expected structure.
- Freshness checks ensure data updates on expected cadence. If a table typically loads at 9am daily, alert if no update has occurred by 10am.
- Volume thresholds detect incomplete data loads. If daily volumes typically range from 900K to 1.1M rows, alert when a day produces only 50K rows.
- Custom business logic enforces domain-specific rules. Revenue should never be negative. Order dates should fall within the last 180 days. Geographic codes should match a reference table of valid values.
Smart assertions use ML-powered recommendations to identify which checks matter most for each dataset based on historical patterns and usage. This reduces the manual effort of designing comprehensive checks from scratch.
Bulk column monitoring applies validation across hundreds of columns simultaneously. Instead of creating individual NULL checks for 50 columns, apply a single assertion that monitors NULL percentages across all columns and alerts when any exceed expected thresholds.
4. Configure smart alerting
Alert quality determines observability effectiveness. Too many false positives create alert fatigue where teams ignore notifications. Too few alerts mean issues go undetected.
Route alerts to the right owners automatically based on metadata ownership. When a quality issue affects the customer_transactions table owned by the payments team, the alert goes directly to their Slack channel or email distribution list—not to a generic data-ops inbox where it might be missed.
Include rich context in notifications rather than cryptic error codes:
- Basic alert: “Table customer_transactions volume anomaly detected”
- Context-rich alert: “Table customer_transactions received 50K rows today. Typical volume: 1M rows. Impact: Affects Revenue Dashboard used by Finance team (12 members). Recent changes: Schema modified yesterday by @john_smith. Suggested action: Review upstream API ingestion job.”
ML-powered anomaly detection reduces false positives by understanding patterns rather than applying rigid thresholds. A dataset that grows 15% week-over-week isn’t anomalous if historical patterns show consistent growth. A 5% drop during a typically flat period is anomalous and warrants investigation.
5. Build incident workflows
Detecting data issues is only the beginning. Tracking incidents from detection through resolution ensures problems get fixed and patterns get documented.
Implement incident management workflows that:
- Log all incidents with timestamp, affected assets, detected anomaly, and business impact
- Track ownership and status so multiple responders don’t duplicate effort
- Document root causes once identified to inform future prevention
- Record resolution time to measure improvement in mean time to resolution (MTTR)
- Analyze patterns across incidents to identify chronic issues requiring architectural fixes
Look for platforms with built-in incident management rather than alerts that fire once and disappear into Slack history. Structured incident tracking provides the audit trail needed for retrospectives and the historical context needed for troubleshooting similar future issues.
6. Report improvements to drive organizational buy-in
Once you’ve resolved incidents faster and prevented downstream issues, document the improvements to demonstrate value across the organization.
Generate reports that show:
- Mean time to resolution (MTTR) improvements—from days to minutes
- Prevented incidents caught before impacting business users
- Reduction in data-related support tickets and escalations
- Time saved by data teams (hours previously spent firefighting)
- Increased data trust scores from business stakeholders
Share these metrics with leadership, data consumers, and adjacent teams. Quantified improvements build organizational confidence in data initiatives and secure resources for broader implementation, expanding observability coverage, implementing preventative strategies, and scaling governance programs.
Teams that demonstrate clear ROI find it easier to justify headcount, tooling investments, and strategic data quality initiatives. The reporting creates a virtuous cycle: Improvements generate metrics, metrics drive buy-in, buy-in enables further investment in prevention.
7. Real-world results
Organizations implementing comprehensive data observability report dramatic improvements in data reliability and team productivity.

Before bringing DataHub on board, our data teams would see multiple breaking changes per week. Since integrating DataHub into our workflow … DataHub has helped us significantly reduce the number of breaking changes, to the extent that they are no longer a burden on all teams.
Asad Naveed
Engineering Manager, MYOB
Results like these stem from the unified platform approach: column-level lineage prevents breaking changes by showing impact before deployment, automated assertions catch issues proactively, and context-rich alerts enable rapid resolution when incidents do occur.
Teams commonly report incident resolution dropping from days to minutes when they have unified context. The time saved compounds across an organization—data engineers spend less time firefighting and more time building, analysts trust their dashboards enough to make decisions confidently, and executives increase investment in data initiatives that demonstrate reliability.
8. Avoid these common pitfalls
Even with the right strategy, teams often stumble on predictable implementation challenges:
- Alert fatigue from false positives: Rigid rule-based monitoring generates noise when data patterns shift naturally.
- Solution: ML-powered anomaly detection that adapts to seasonal patterns, growth trends, and data lifecycle changes.
- Monitoring without ownership: Alerts that fire into a void where no one knows who should respond waste the detection value.
- Solution: Automated routing based on metadata ownership and team structure.
- Treating observability as separate from discovery: Creating another tool to switch between during incidents slows resolution and breaks context.
- Solution: Unified platforms that connect observability with discovery and governance in a single interface.
- Focusing on tooling before identifying critical data: Teams that start by deploying comprehensive monitoring across everything get overwhelmed by alerts before proving value.
- Solution: Start with business impact, identify critical datasets, prove value, then expand systematically.
9. Consider build vs. buy considerations
Building data observability in-house appeals to teams with unique requirements or existing infrastructure investments. But the effort required often exceeds initial estimates. Building a comprehensive solution in-house can require significant engineering time and may cost hundreds of thousands of dollars in labor and data infrastructure.
DataHub offers immediate time-to-value through:
- 100+ pre-built connectors for common data sources, eliminating custom integration work
- Flexible APIs and SDKs for extending to proprietary systems
- ML models for anomaly detection battle-tested across common data quality patterns in CPG, e-commerce, financial services, and more
- Event-driven architecture proven at scale (billions of metadata events daily)
- Managed services that handle infrastructure, performance tuning, and availability
Open-source foundations provide extensibility without vendor lock-in. The innovation from 14,000+ community members and proven adoption across 3,000+ organizations de-risks the investment while maintaining flexibility to customize for unique requirements.
The build vs. buy decision ultimately depends on whether observability is a core competency you want to maintain in-house or a capability you want to adopt quickly to focus engineering resources on differentiated business logic.
See DataHub in action
Why AI requires different data observability
Artificial intelligence fundamentally changes what data platforms must deliver. The observability practices that sufficed for analytics fall short when supporting production AI applications.
The AI production paradox
AI pilots succeed with carefully curated datasets where data scientists manually validate quality and monitor performance. Production breaks these assumptions.
Production AI requires data pipelines that ingest messy real-world data continuously, handle schema drift from third-party APIs, process both structured tables and unstructured documents, and feed ML models serving real-time predictions to customer-facing applications.
The gap between pilot and production stems from the challenge of ensuring reliable data across fragmented tools. Separate systems for data quality, metadata management, ML monitoring, and governance create blind spots where issues slip through undetected. Organizations struggle to deploy AI confidently because they lack unified assessment of data quality, lineage, governance, and compliance.
What AI-ready observability requires
- Unified visibility across all data types: Monitor quality in warehouse tables and unstructured documents. Track schema evolution in relational databases and document structure drift in PDFs and JSON files.
- Native ML asset support: Catalog ML models, training datasets, feature stores, and prediction outputs. Trace lineage from raw training data through feature engineering to model artifacts to inference endpoints.
- Event-driven architecture: Process metadata events as they occur—legacy batch systems create dangerous delays between data changes and model retraining.
- AI Fitness assessments: Define what makes data AI-ready through metadata tests covering lineage documentation, governance standards, quality thresholds, and validation that models aren’t trained on prohibited data. DataHub’s certification workflows guide teams to improve critical datasets before they feed production AI.
- Machine-scale access: Expose metadata through robust APIs that AI agents consume programmatically. Agents need to discover datasets, understand lineage, and validate quality without human translation.
Building for machine scale, not human scale
Legacy catalogs were built for analysts searching tables occasionally through web interfaces. Production AI requires platforms that support thousands of automated pipelines and AI agents querying metadata continuously through APIs.
DataHub‘s event-driven architecture handles this shift. The platform processes billions of metadata events, supporting environments with 400,000+ cataloged entities, 100,000+ orchestration tasks, and 35 billion data records validated through real-time assertions.
This isn’t an adaptation of existing tools. It’s an architectural foundation built for machine velocity from the start. As AI adoption accelerates, the gap between human-scale discovery tools and machine-scale requirements will only widen.
Product tour: See DataHub’s data observability in action
DataHub unifies observability, discovery, and governance in a single platform—cutting incident resolution from hours to minutes with column-level lineage, automated assertions, and context-rich alerts.
Attend a live demo to see how DataHub handles enterprise-scale data observability for both traditional analytics and production AI.
Ready to turn reactive firefighting into proactive monitoring?
DataHub delivers automated monitoring and instant impact analysis that prevent breaking changes before they reach production.

Explore DataHub Cloud
Take a self-guided product tour to see how DataHub unifies data observability, discovery, and governance in one platform.
Join the DataHub open source community
Join our 14,000+ community members to collaborate with the data practitioners who are shaping the future of data and AI.
FAQs
Recommended Next Reads