


Data Observability Made Smarter: What’s New in DataHub Observability
At its core, data observability is about ensuring the health, reliability, and quality of your data pipelines so issues are caught before they disrupt the business. But knowing why data observability matters is only half the battle. The real challenge is putting it into practice across complex, evolving data stacks.
As a data observability platform, DataHub helps teams detect issues earlier and keep pipelines healthy. We’ve listened closely to your feedback and made the latest release faster, smarter, and more intuitive.
Here’s what’s new:
- Bulk-setup anomaly detection across all your datasets in just a few clicks
- Integrate assertions and notifications directly into developer workflows
- Fine-tune AI Smart Assertions by giving real-time feedback
- Add rich context to assertions for easier investigation and resolution
- See the big picture with a bird’s-eye-view Data Health Dashboard
In this article, we’ll dive into these updates and show how they make practicing data observability simpler, more scalable, and more effective.
Our data observability focus: Detect quality issues, fast
DataHub Observability is built on three pillars: Detect, Resolve, and Improve.
Over the past few months, we’ve zeroed in on the first pillar—Detect—and streamlined the entire journey.
The goal of detection in data observability is simple: make sure the right people know about broken data before it impacts the business. That journey comes down to three steps:
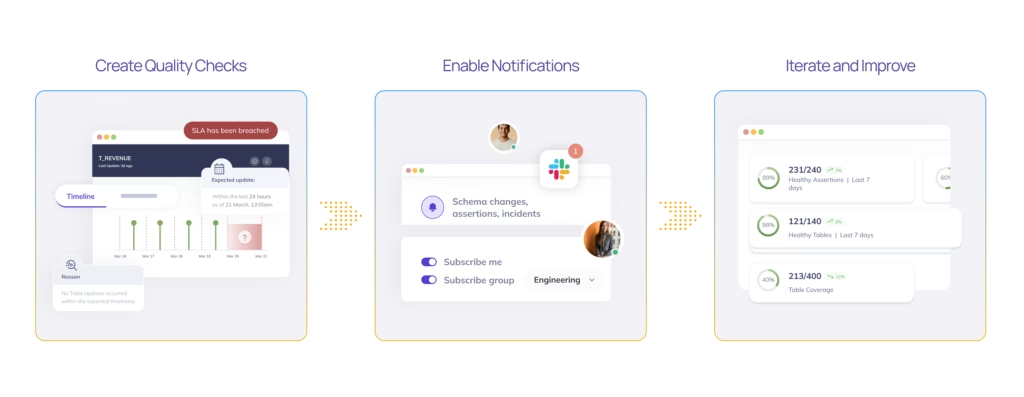
- Create quality checks: Monitor for freshness, volume, and validity across key datasets.
- Enable notifications: Make sure the right people get alerted the moment something breaks.
- Iterate and improve: Cut through the noise by fine-tuning checks and sharpening signal over time.
With this release, we’ve enhanced every step in the detection flow. So issues surface faster, alerts reach the right owners, and your data stays reliable.
Creating assertions and subscriptions just got easier
Monitor all your key datasets in just a few clicks
Monitoring your datasets is now faster and simpler. With the Data Health Dashboard, you can create:
- Freshness Assertions (Smart and Traditional)
- Volume Smart Assertions
- Schema change alerts and other subscriptions
What are Smart Assertions?
Smart Assertions are anomaly detection monitors that train on the historical patterns of your data to predict what “normal” looks like. Powered by a sophisticated ML pipeline, they adapt to a wide range of data trends, including seasonality.
Screen recording of the Bulk Create functionality in DataHub.
You can also bulk-create Column Metric Smart Assertions directly from the Quality tab on individual datasets.
Screen recording of Column Metric Smart Assertions in DataHub.
For teams chasing end-to-end visibility, the Stripe story offers a practical look at data pipeline observability in action.
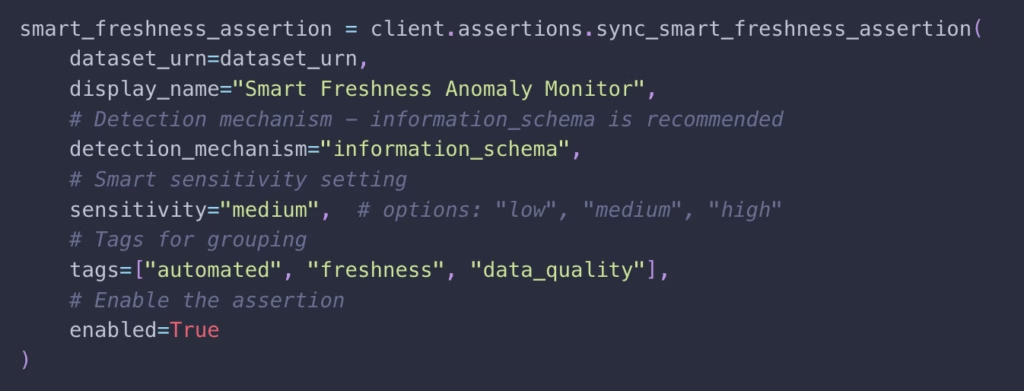
Developer integrations
To make data observability automation even easier, we’ve introduced a lightweight Python SDK to programmatically manage:
See our docs for code snippets and bulk management tips.
And we’re not stopping there. A CLI with YAML-codified assertions is in the works, giving you even more flexibility to integrate directly into developer workflows. Stay tuned on our blog for updates.
New tools to improve assertion usefulness
Tune Smart Assertions in real-time
Smart Assertions are now more adaptive than ever. You can fine-tune them instantly by giving direct feedback on individual evaluations:
- Flag a failure as “Not an anomaly”: The model adds this data point to its training set and adapts accordingly.
- Flag a success as “Anomaly”: The model removes this data point from its training set to reduce false positives.
- Train as new normal: Useful for one-time changes in data, this option re-trains the model starting from the selected data point onward.
Tuning Smart Assertions in DataHub with real-time feedback.
You can also quickly adjust training data and see the impact immediately:
- Drag to exclude entire ranges of bad data
- Adjust sensitivity and look-back days
- Preview the effect on data observability predictions in real time
Visualizing prediction changes after tuning Smart Assertions.
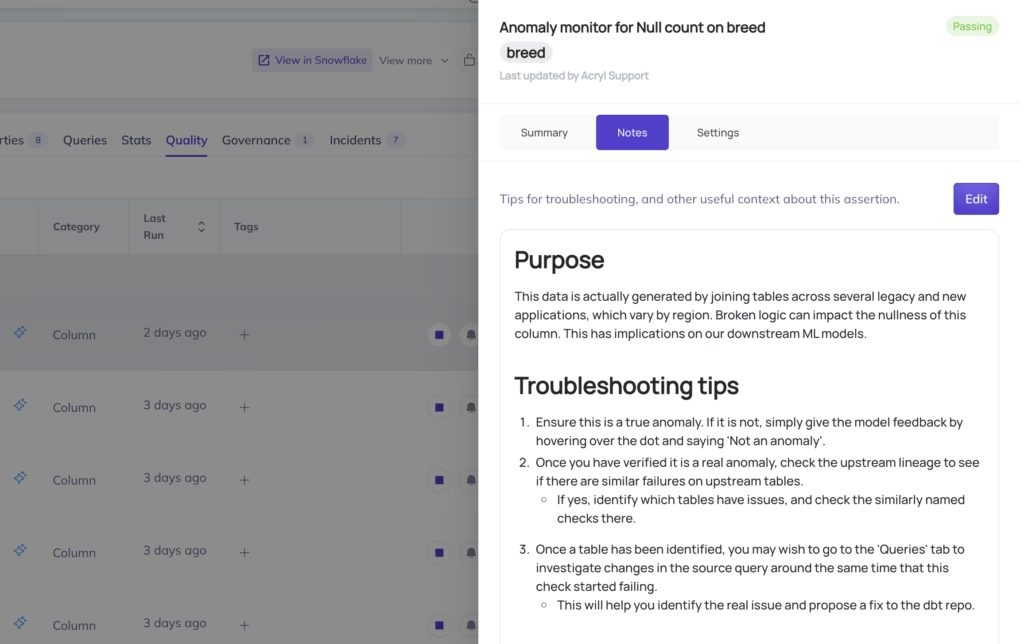
Add notes to Assertions
Often, engineers on call don’t have the full context needed to quickly resolve an assertion. SQL-based assertions in particular can be difficult to interpret without knowing their intended purpose.
To bridge this gap, authors can now add notes directly to Assertions, explaining why they were created, what they check for, and even leaving troubleshooting tips for teammates who may handle future incidents. This shared context helps speed up resolution and improves team collaboration.
Elevate the signal, cut the noise
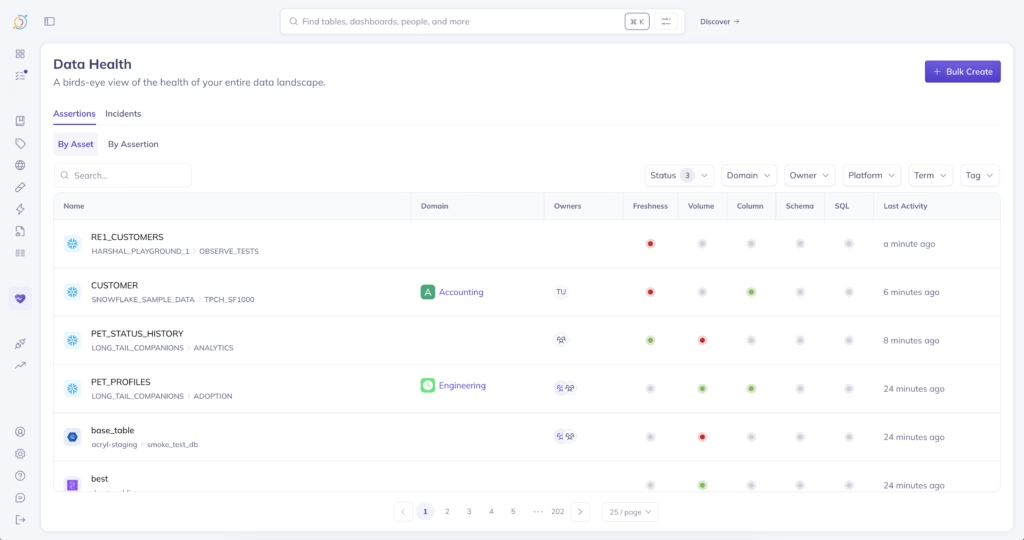
Bird’s-eye view Data Health Dashboard
The Data Health Dashboard centralizes your data observability practice, giving teams a clear, high-level view of your organization’s data quality. It’s designed to solve two critical use cases:
- Triaging issues: Quickly spot and prioritize data quality problems that need immediate attention.
- Tracking coverage and trends: Understand the broader health of your data over time, including where checks are in place and how they’re performing.
You’ll find the Data Health Dashboard in the sidebar under the Observe section.
There’s more where that came from
We’re just getting started. Our investment in the Detect pillar will continue throughout the year, with improvements like richer Slack alerts, deeper integration into developer workflows, and more advanced anomaly monitors already on the roadmap.
For our customers: your feedback shapes the future of DataHub. If there’s something you’d like to see in DataHub Observability, reach out to your customer success rep. We’d love to hear from you.
Ready to strengthen your data observability strategy?
As you scale data observability and automation, consider how DataHub Cloud can unify governance, deployment, and access across your data stack.
- Learn more about data observability in DataHub
- Book a meeting with our team to see how DataHub can help scale your data quality strategy
Recommended Next Reads